
Debugging Web Apps with Vega Studio
Open Beta Documentation Amazon offers this technical
documentation as part of a pre-release, open beta. The features described might change as Amazon receives feedback
and iterates on the features. For the most current feature information, see the latest Release
Notes.
Vega Studio is the integrated development environment (IDE) for Vega Apps. It integrates with Chrome DevTools (CDT) to attach and debug WebView apps. With CDT, you can inspect rendered HTML content and debug JavaScript by setting a break point, like an ordinary web app.
Use the following guide to set up a CDT debugging session using Vega Studio.
Prerequisites
- Install Visual Studio Code.
- Install Vega Studio extension (0.21 or later)
Steps to debug your Vega Web App
- Open your app with Vega Studio.
- Build a debug variant and launch it.
- Launch your app one of these two ways.
- Launch from command line.
-
Tap the Play button on the Vega Studio side bar.
Note: To debug with Chrome DevTools, build the target app with a debug configuration.
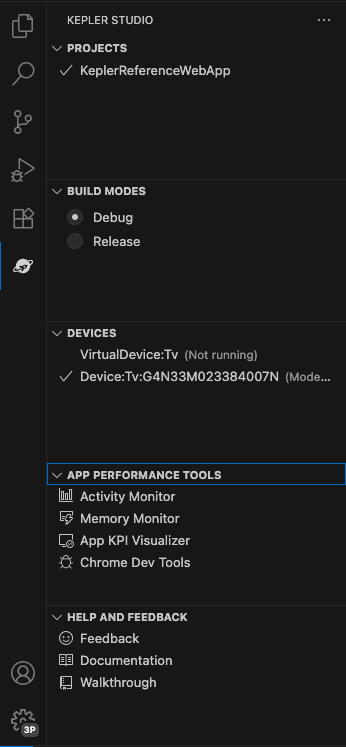
- Launch Chrome DevTools from VegaStudio
-
Open the Vega Studio side bar and click "Chrome DevTools."
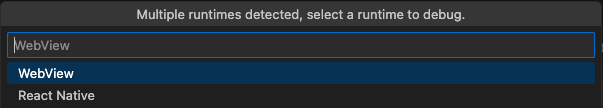
-
Notice the combo box to select the target runtime. Select WebView to debug HTML + JavaScript content running on WebView.
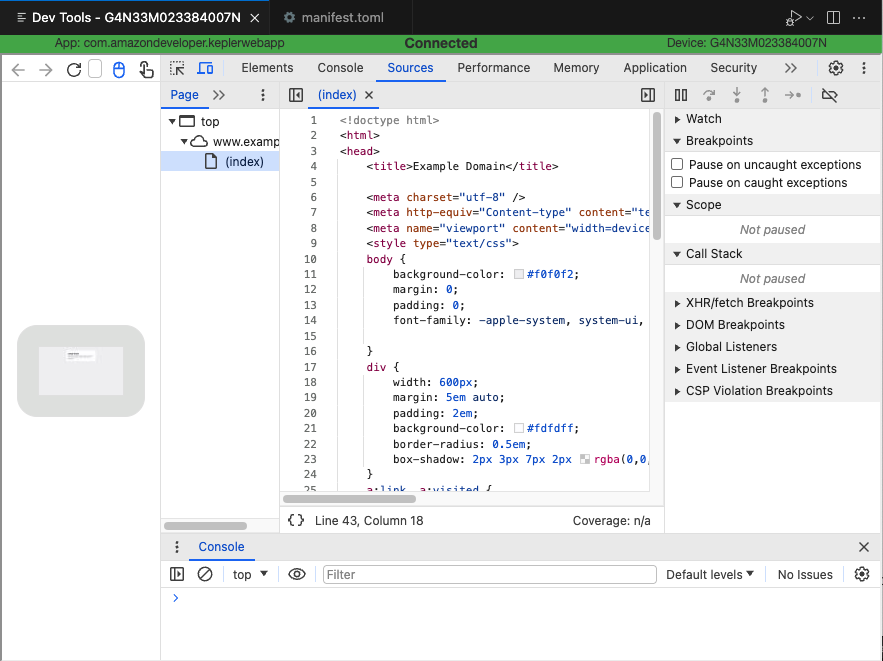
- Chrome DevTools appears in the editor and attaches to the WebView runtime. You can inspect HTML and JavaScript source code, as well as set breakpoints in the JavaScript code.
Related topics
- For more about Chrome DevTools, see Use Chrome DevTools for App Profiling
- Overview of Vega Web Apps
Last updated: Feb 19, 2026