
Inspect Your App with Appium Inspector
Appium Inspector is a companion tool for Appium that helps in writing reliable automated test scripts for native, mobile, and hybrid apps. It lets you view an app's screen and page structure, exposing the underlying UI elements and properties.
Appium Inspector is a free, open-source tool hosted on GitHub. It provides visibility into an app's UI, letting you:
- Inspect the app's screen and page structure
- Select UI elements and view their properties
- Use XPath expressions to search for elements
- Perform actions like clicking on selected elements
- Record scripts for automated testing
Prerequisites
Make sure you complete the steps in Install Appium for Vega Integration.
Inspect your app
-
Connect your device:
Fire TV Stick:
kepler exec vda connect <DEVICE_IP>kepler exec vda devicesVega Virtual Device:
kepler virtual-device start -
Start the automation toolkit:
vda shell touch /tmp/automation-toolkit.enable -
Run the Appium Server:
appium -
Launch the Appium Inspector:
On Mac: Open from the Applications folder or Spotlight search
-
Add capabilities.
Learn about the required capabilities in Manage Appium Sessions.
-
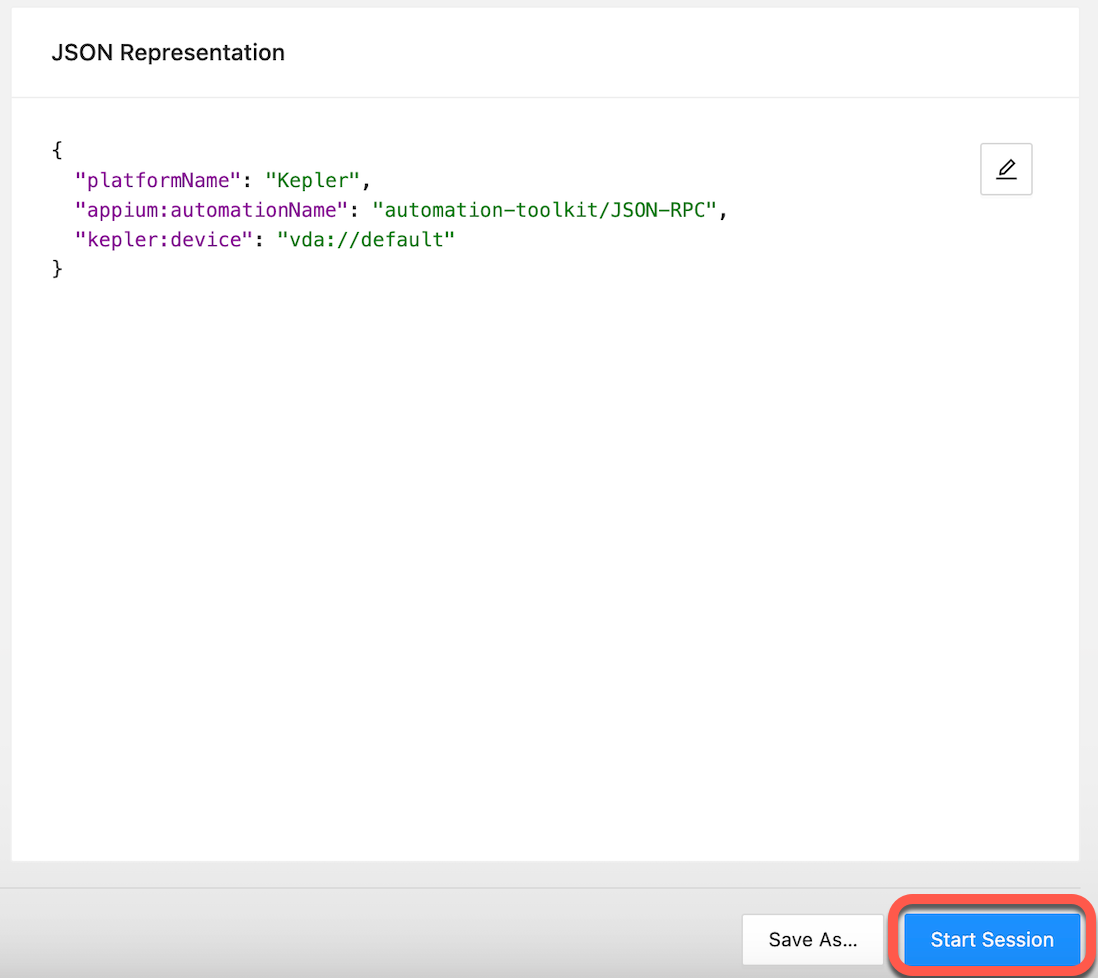
Click the Start session button to start the Appium Inspector.

Example of JSON capabilities:
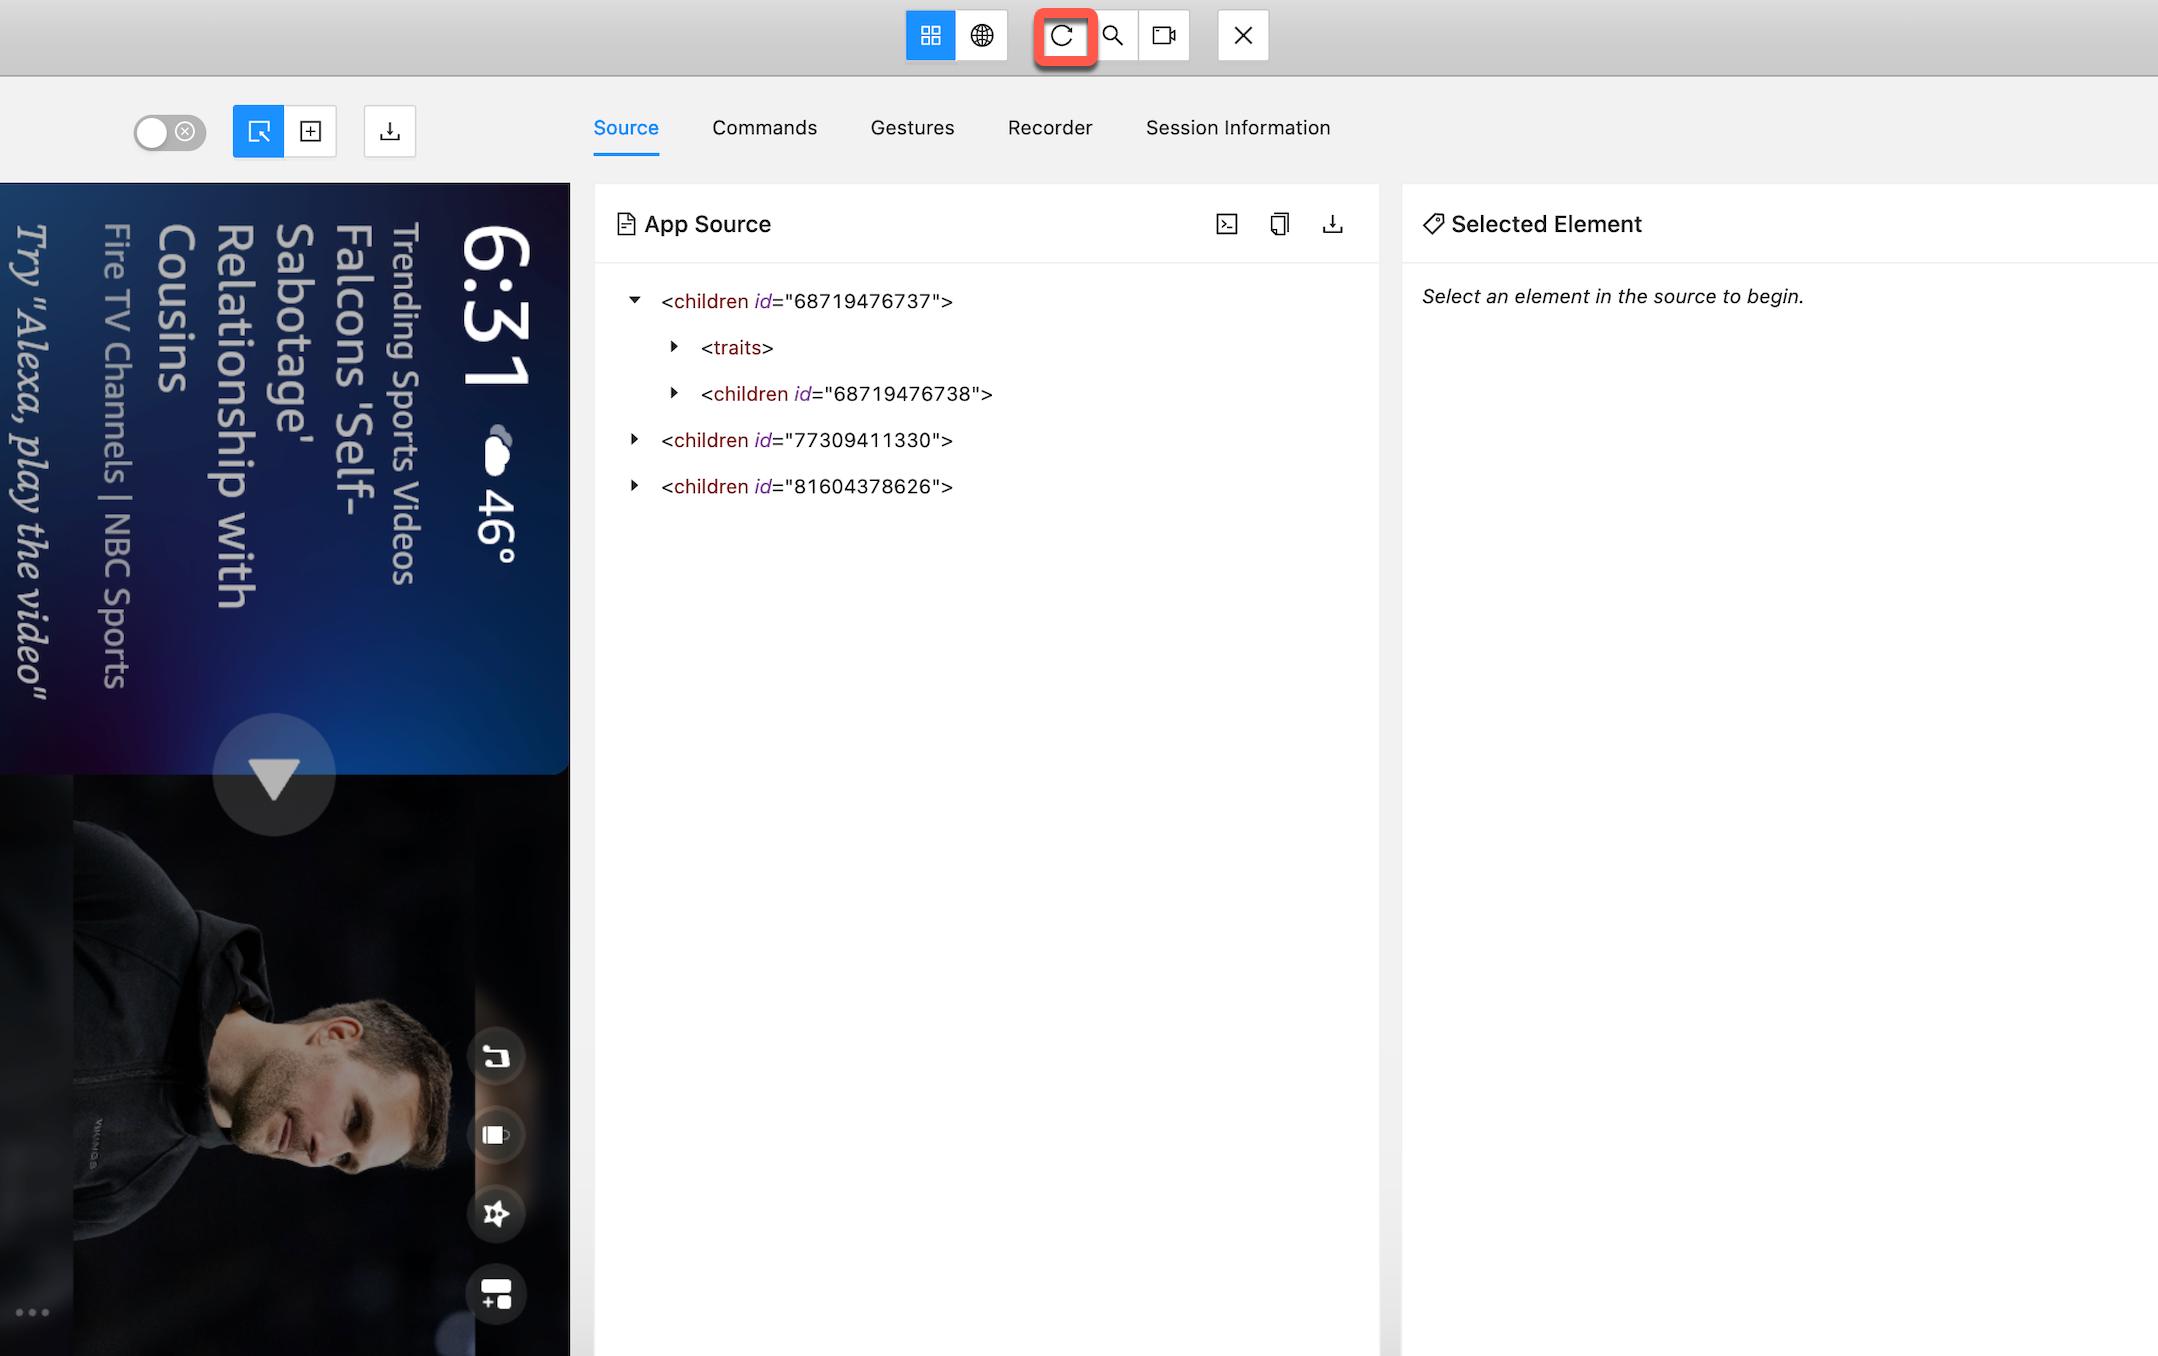
{
  "platformName": "Kepler",
  "appium:automationName": "automation-toolkit/JSON-RPC",
  "kepler:device": "vda://default"
}
Appium Inspector captures screenshots and shows XML source in the App Source panel.

To update the displayed content, click the Refresh Source and Screenshot button.
Other functionalities
Select an element
In the App Source panel, select an element from the displayed XML tree.
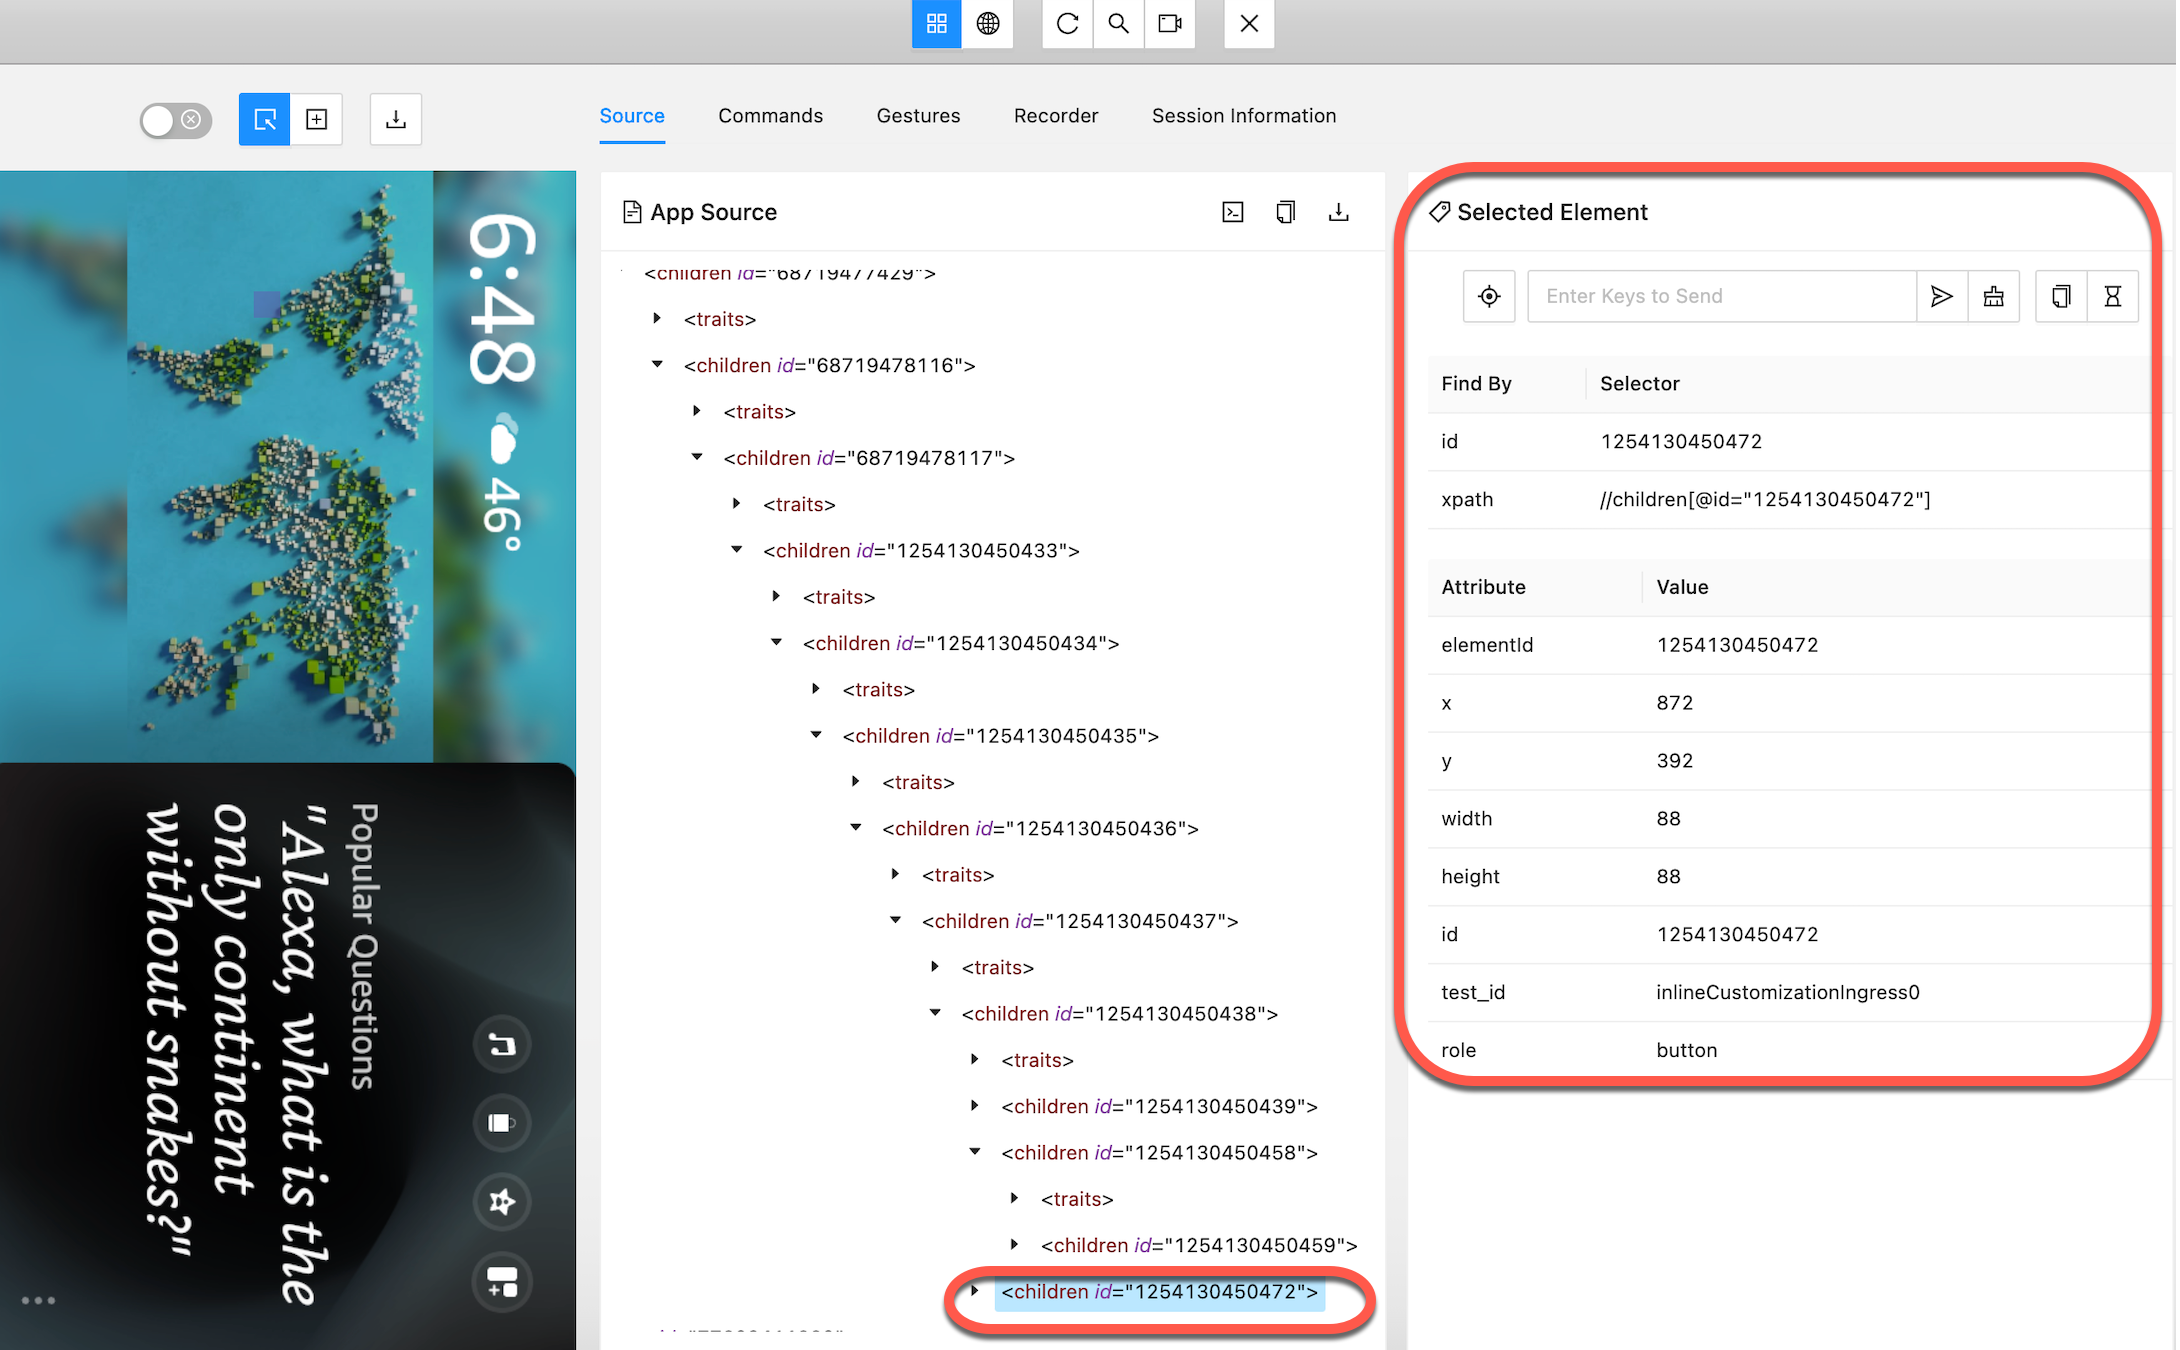
The page displays the element properties and available actions in the Selected Element panel.
Use xpath expressions to search for elements
Appium Inspector suggests a XPath selector with an id for the selected element. However, id values can be dynamic. Instead, use the test_id attribute or other attributes like role or description for more reliable element selection.
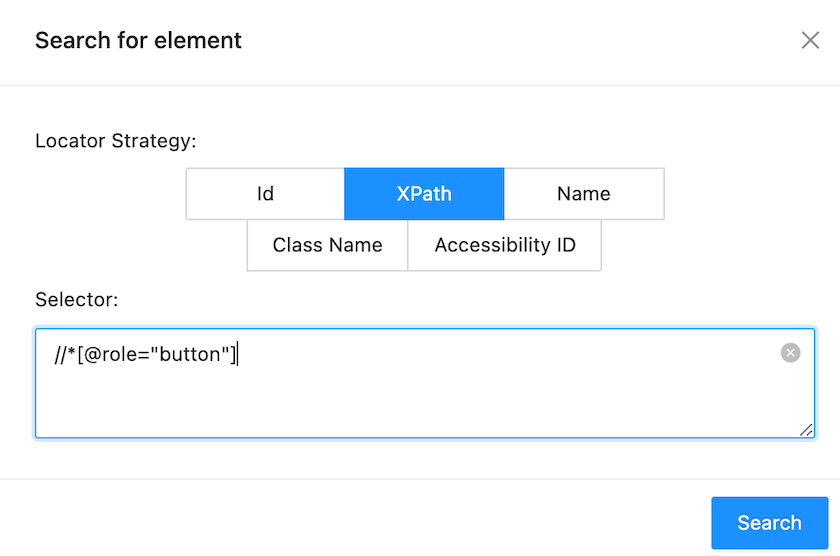
Examples of valid xpath expressions
//*[@role="button"]to get all the elements containingrole="button"attribute.//*[contains(@description, "Music")]to get all the elements containingMusicin thedescriptionattribute.
To test your xpath expressions, use the Search button.
Perform a click
To perform a click on the selected element, use the Tap icon.
Record a script
Appium Inspector lets you record a script based on your interactions with the app:
-
Launch Appium Inspector and connect to your device.
-
Click the Record icon in the top bar to start recording.

-
Perform the necessary actions:
In the Search for Element panel, perform actions like locating elements and interacting with them using the Tap icon. The script area shows all your actions as you record.
-
Reclick the Record icon to stop recording.
Use the generated script as a starting point for your automated tests or modified as needed. In the example, the
sampleTestmethod captures the recorded actions.To change the script's recording language, use the drop-down menu in the Recorder panel's top-right corner.

Troubleshooting
If you encounter an issue, provide the details in community.amazondeveloper.com.
Last updated: Oct 31, 2025