
ファイル、クラッシュレポート、ログの管理
Visual Studio Code(VS Code)の拡張機能であるVega Studioは、デバイスファイル、クラッシュレポート、ログの包括的な管理を提供することにより、アプリのデバッグ機能を強化します。Vega Studioを使用すると、アプリの動作の監視、クラッシュの調査、システムログの分析を一元的に行うことができます。これらのデバッグ機能は、問題を特定し、開発中のアプリの動作を確認するのに役立ちます。
前提条件
開始する前に、次の手順を実行してください。
- VS Codeでアプリプロジェクトを開きます。
-
USBまたはネットワーク経由でデバイスを接続します。
- 手順については、Vega仮想デバイスまたはFire TV Stickでのアプリの実行を参照してください。
-
お使いのデバイスがVega Studioのデバイスリストに表示されます。
- 基本機能と詳細構成オプションについては、Vega Studioのセットアップと使用方法を参照してください。
クラッシュレポートの管理
クラッシュレポートを管理するには、[Explorer] サイドバーの [Device Files] ビューを使用します。このビューは、接続されたデバイスからのクラッシュレポートを自動的に検出して表示します。
![接続されたデバイスとクラッシュレポートがツリー構造で一覧表示された [Device Files] ビューを示すVS Codeの [Explorer] サイドバーのスクリーンショット](https://d32acggsvimfuc.cloudfront.net/device-files-view.png?Expires=1924905600&Signature=pBymuFrKTr2FXCTA87qIgxb5LuGS14bW-baP3q~1SmwcPnpqH-KPJqr8z2kreh0R3KV9fSDRdkzKAoaoC~Om9IbWyXyvuGcHn70eaY3tPxrDkBaTsjNovyl64YEWQLlMFJjXGnzLpMfu-XL1zUzog22ACz3Lvg4gZLpSnvRtgnZOmKerPkmFaUjN~TKCvEb65zO-uM3qRnnrcOz3fTxHruhXO2FHLqrJRHtJfoZDKKh8Y7tA3iy~uoCnzLn0ZzSGJkTHWJjfas6cZf5a1e1R8Ha~DCd0blNyemHWbNcS7Pgg7-xIKp5J72zJGUlPKLjP1eR3X8X54~YL1wWEiaNRLA__&Key-Pair-Id=KG9NA58BI3UFQ)
クラッシュレポートを開いてシンボリケート
- 一覧から該当する項目をクリックして、クラッシュレポートを開きます。
-
右クリックして [Symbolicate ACR] を選択すると、クラッシュレポートが読みやすい形式に変換されます。
- 詳細については、Vega Studioを使用してアプリのクラッシュをデバッグする方法を参照してください。
![[Symbolicate ACR] オプションが強調表示された [Device Files] ビューの右クリックコンテキストメニューのスクリーンショット](https://d32acggsvimfuc.cloudfront.net/symbolicate-acr.png?Expires=1924905600&Signature=yjhdi94GZPVDnAQazZP74oGNlZv90OPwomnq5Zj50yxnT~BWTC9pmtMqiOt7VVs8ocGN6E0ENoaiDqhu374s6QwWItmjwgQeDjPm44Y2kv0Gggf~5vtZVkv0WIfQsrGEBJdIdoCKCCrFHTnr9tr0TVWfl5ThSJzW8IZ-gzGjknw2ztiTAwb50rJUJ-puOUf7NY18v1QN8EPesUwp1CtcVzeSnmKHePw~-pt6lXP7B05Yv4Wk3aYVekyuDlCC844wsEC6sAJHoqMnNaNBTNhGbyPfTOAcMKugfifUiX0FAlMV57Oeqm1~sKSuj9zhfLmmh-bkem73mGzFmgEZIc9bWA__&Key-Pair-Id=KG9NA58BI3UFQ)
クラッシュレポートのフィルタリング
[Crash Reports] の横にあるファネルアイコンをクリックすると、[Filter Crash Reports] ユーザーインターフェイスが表示されます。

名前または正規表現を使用してフィルタリングできます。
![名前、日付範囲、正規表現のフィルタリングオプションのフィールドがある [Filter Crash Reports] ダイアログボックスのスクリーンショット](https://d32acggsvimfuc.cloudfront.net/filter-cr.png?Expires=1924905600&Signature=noIOf~TBzBJX7LP46uL8q0wIiIeC-uUjYSj-F9ljTriUMR~au98MUx3qQfVR0lA1ZyzvojsDSD7ECjb2CzwZYrzIyXe~NIGnSIV0K7um-I1CcFG~TUoSi3oDRFqMtbUcNU8KRpNsJqRNCOV7JmkD2rfY110K~KfPfdDTMt7w9zo5SIvseud834pbHLbBPmY7jf8Z1AjJE0mOuEBqfnGv~f0rTsuwGCtFNCNQ5rATXoTvwy5yBoLHdx3OHqawLxW61kR96Bqro4fdK2jY-AE8LaP4iHRl9ORwf3jlj44G3TYd7WdReuZc4e2AryJSKvHd~0ElLF6uuceqpc1zkiZSBQ__&Key-Pair-Id=KG9NA58BI3UFQ)
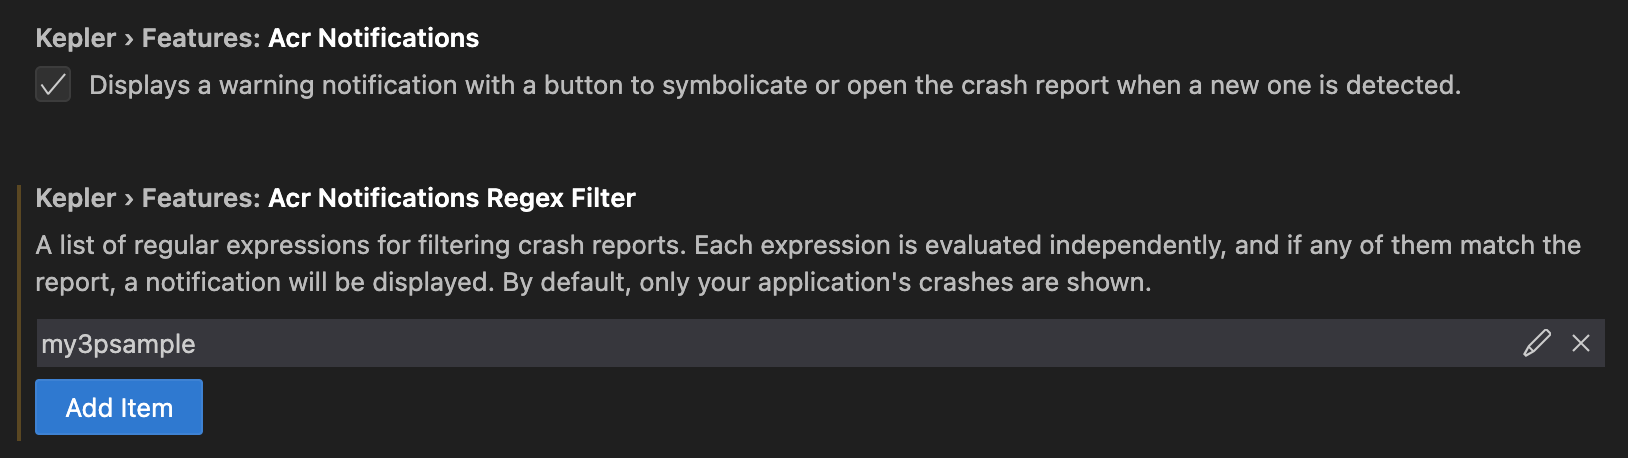
自動クラッシュ検出の構成
Vega Studioは新しいクラッシュレポートを自動的に検出し、通知を表示します。この動作はカスタマイズできます。
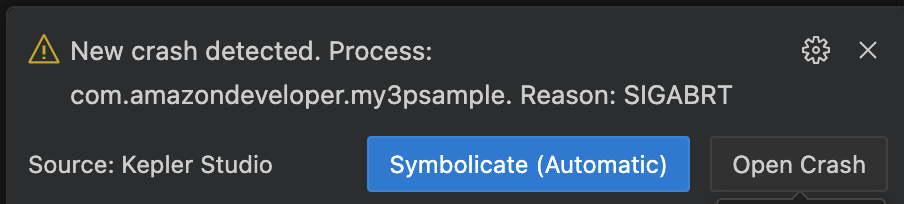
通知を無効にしたり、フィルターを構成したりするには、Vega Studioの拡張機能設定([Vega] > [Features] > [Acr Notifications])に移動します。
ライブログの表示
アクティブな開発中のリアルタイムデバッグには、ライブログストリーミングを使用してください。VS Codeステータスバーの [Show Logs] ボタンを使用することをお勧めします。
- VS Codeでアプリを実行します。
-
ステータスバーの [Show Logs] をクリックします。
![[Show Logs] ボタンが青色で強調表示されたVS Codeのステータスバーのスクリーンショット](https://d32acggsvimfuc.cloudfront.net/ks-show-logs.png?Expires=1777593600&Signature=LxTs-ESA4btVkj6HPEnV3DrhEquoigiS~m4PoQ8nbM0hPiFE2AscabtxIw-t38iOUrsDyg3IzZyD3WiNk6q5nRNjq5YGnAVSwSW1RoyyQ~3oxw0GmCO3QMn8BbJB9QLO2q26oq4y2PVBqLjaEZbzb5kziLv40c3h2XBhXcc9qkAwghacUQSAiVDAqk8MxkAenRSx7MVPYsJEBiV7UVpU83YTE6oEiedbkE0CE1UVU4vcYHJtBvYOFhSNQZDWvrLONaebQcwPQzF7e3GUTQ4ua3JwYcsH1hnwE--AGM2HvPIrQsY6FFXYWO1iDxtCZT6f-2aMhU1FRRRFzmXhE-u3AA__&Key-Pair-Id=KG9NA58BI3UFQ)
ステータスバーの [Show Logs] ボタン -
使用するデバイス Vega仮想デバイスまたはFire TV Stickから選択します。
Fire TV Stickを使用している場合は、USB経由で接続します。複数のプロジェクトがある場合、プロンプトが表示された時に対象のプロジェクトを選択します。
アプリの実行中、ログは [App Logs] チャネルにストリーミングされます。アイドル状態のアプリの場合は、[出力] チャネルを確認してください。
![接続されたデバイスからのストリーミングログメッセージが [App Logs] チャネルに表示された、VS Codeの [出力] パネルのスクリーンショット](https://d32acggsvimfuc.cloudfront.net/ks-logoutput.png?Expires=1777593600&Signature=ZXDBhl4zjCSz7MaNRHKvLB-XXQmGpnyE7jGcimEi1OlO96VwMV3Kai7Cg0VGplniSy2U9YIwO6c48GI4QlT1WPVM5WwfBdJI5aZXb62ohKGdNSRrkAH8tfdu9SwbXNwztQ0tYda53BiqrN1ZqyPe5eGisvw13uPVAzXrf5CVTzUOcxJEVyaZOFWhex4jTUjehxJxQpWNXCowf-KPhfYG6GGIC59dE1JwmdbY-Rv42TJ64twQhZ2ECatcRsmzgJZZJn12maff~JgoALEv~cAG1rxuUhQ4Jgyst9NZ7NpCu6djuzm5tLeJTyGUNjHxq8u4MPTO3UTubPfNiY1LLkqBPg__&Key-Pair-Id=KG9NA58BI3UFQ)
[App Logs] 出力チャネル -
ステータスバーの [Stop Logs] をクリックしてストリーミングを終了します。
![[Stop Logs] ボタンが強調表示され、アクティブなログストリーミングセッションが表示されたVS Codeステータスバーのスクリーンショット](https://d32acggsvimfuc.cloudfront.net/stop-logs.png?Expires=1924905600&Signature=zOG330VRQlPcxCDcRuN1uqbz3yUm1jAhUSGJKcjrVJwc25y~sqo7~XGiSSouNsylxIQvlsO25Eyke0wvJTuWfaT9oUqM-Q8SUJTl9DQF07M2M54z~Hp0h-oQ3vGdaPF3Jrhu9NELFtYENyi82hz94Vw5uTPiMU5viqRHP~pp3BQVCBmxoRovMF5TlhXoRc3Pw0AENg5Jy6Fj89X8-UovdMz3-gH5DY7yOa2LEF62TNa3-EdpJA3T-ZOIVYUodRepa5Zy~P7LM7fD77hI3Yvfkt7ttGxsnThQF5MpLoD~kbOXUJYtg5O1yQ6WMKFTtthLfpI7mqc-Yt~husUPhOVm9g__&Key-Pair-Id=KG9NA58BI3UFQ)
[Stop Logs] ボタン
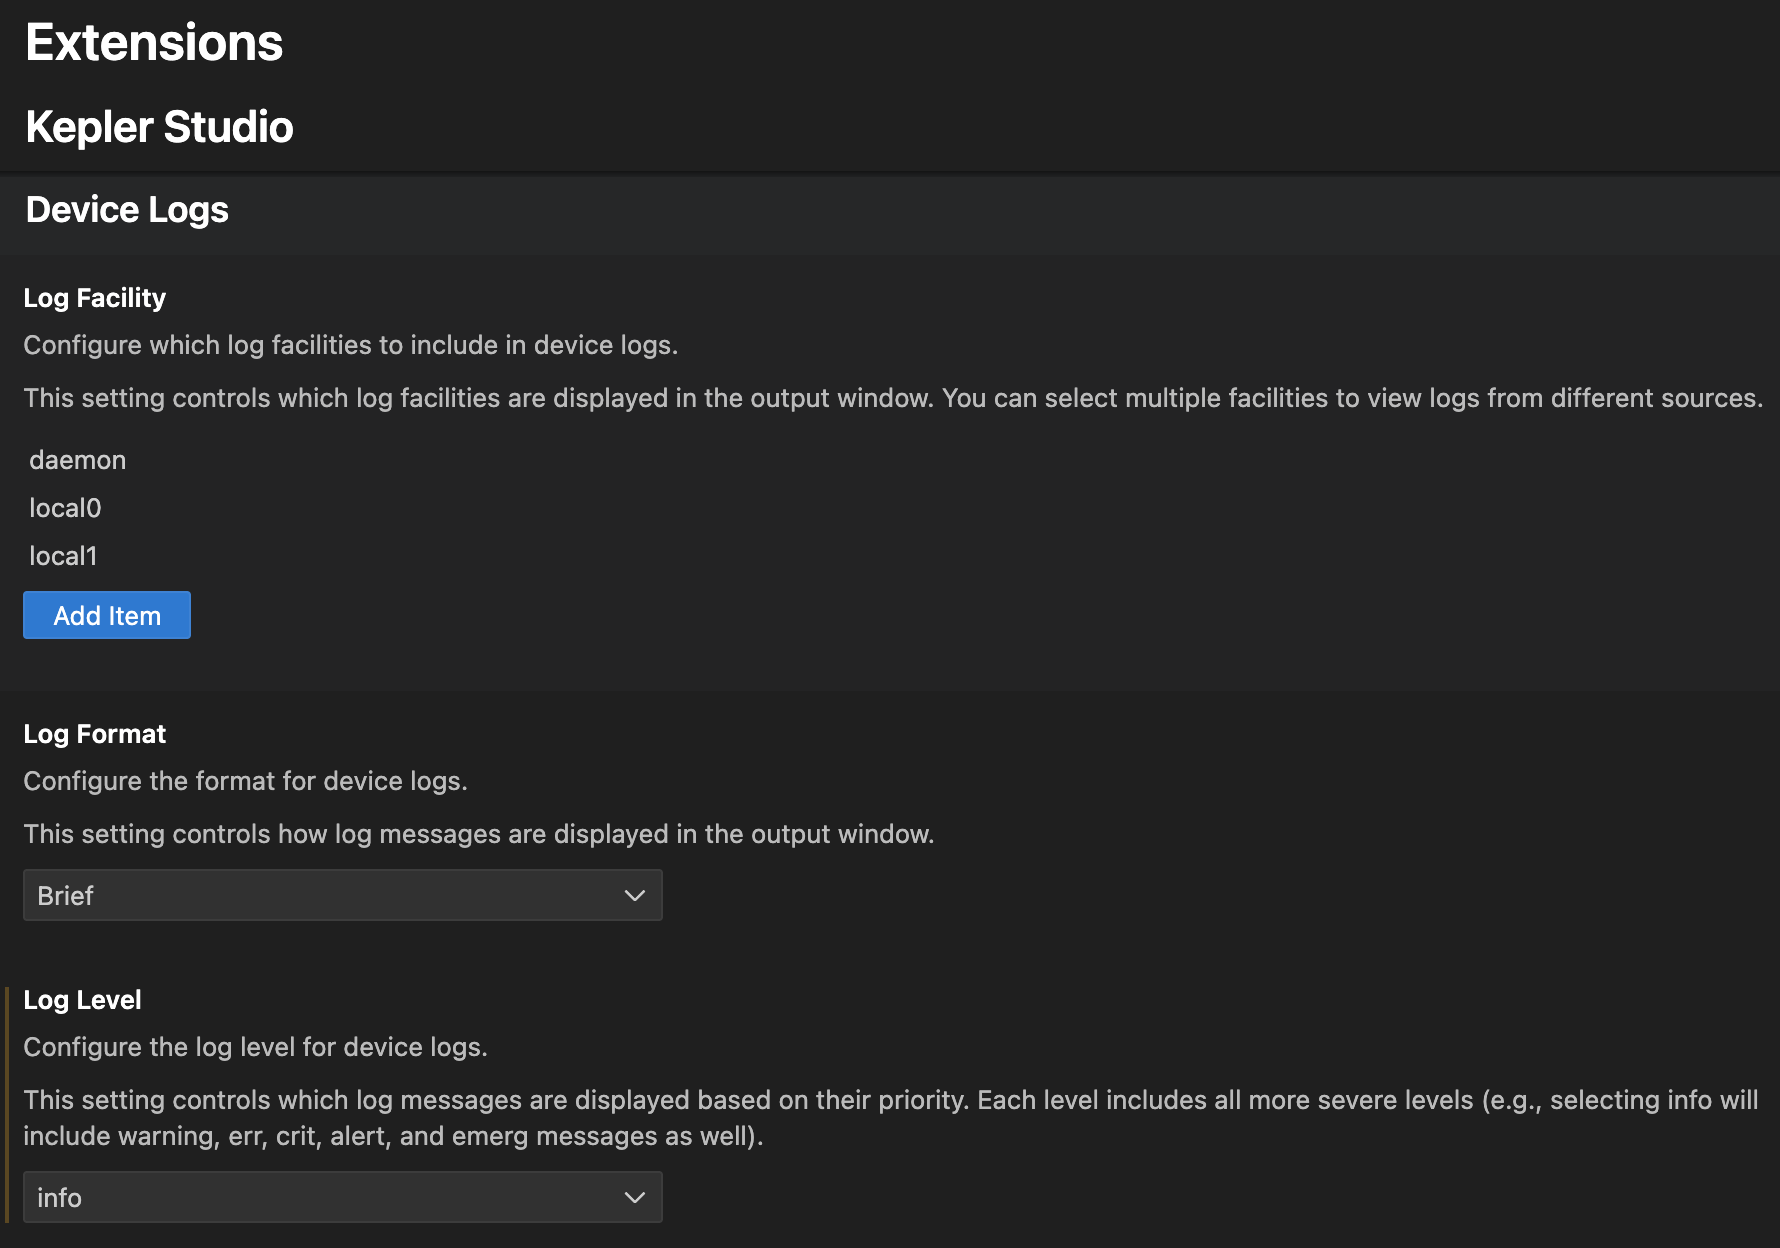
ログストリーミング設定の構成
ログファシリティ、フォーマット、レベルなど、Vega Studio拡張設定でログストリーミングの動作を調整します。変更を有効にするには、ログストリーミングを停止して再起動する必要があります。詳細な構成については、システムログの管理を参照してください。
デバイスログのコピー
ログをコピーして履歴データを分析したり、チームメンバーとログを共有したり、問題を調査したりできます。次のいずれかのオプションを使用してください。
オプション1: [Device Files] ビュー(推奨)
[Device Files] ビューでデバイスを右クリックし、[Copy logs] を選択します。システムはログを<プロジェクトディレクトリ>/logs/<デバイス名>/<ログの種類>/var_log/に保存します。
![[Copy logs] オプションが強調表示された、[Device Files] ビューで右クリックしたときのコンテキストメニューのスクリーンショット](https://d32acggsvimfuc.cloudfront.net/copy-logs.png?Expires=1924905600&Signature=t3gM~khx7O1QPo1JkILgPJhixLHvenCgzwCUsBucY11YXZMpldZAfgi2l9F4Nn-Hmc0WLqZNV7LVmVjT8YhqALN1JisouYSbfINdkSITTHlaFgyII2~nM56LdUJrtFfMjT5sRcDToqNBYzgAK6EIgs6IvVjBWRYQGXVlDK~-bTo457uG8T9KhjIv99H7308hbSJFKD1i-WKvhMxVl2m8RXxmZJXSik6l2REVArfDaYJwoEY8qF6ltnqubAmwrIcpNU6cKL2EfF7CB5DTA304hCVeGe4yLukGzYLhescInuOlbOOldC0NfHeZUaBAaXFjoxg263ZKPtAGeWkYBtVpwQ__&Key-Pair-Id=KG9NA58BI3UFQ)
オプション2: コマンドパレット
- VS Codeのアクティビティバーで、Vega拡張機能のアイコン
 をクリックします。
 - [Devices] セクションに移動してデバイスを選択するか、コマンドパレットに「Vega Device Management: copy logs from device」と入力します。
-
コピーするログをリストから選択します。

ログの収集 -
[出力] チャネルで完了ステータスとファイルパスを確認します。
![完了ステータスとデバイスログのコピー先のファイルパスが表示されたVS Codeの [出力] パネルのスクリーンショット](https://d32acggsvimfuc.cloudfront.net/ks-log-output.png?Expires=1777593600&Signature=elp6vOOGOT8tyz-WzGgv7d3JyMbGiFBcajsMsG2RQDLqfPZQ-zYouhVqmdRB82JCWAF9PtRaaa-xdi72V38TdE0id-E-N6nHuinJw3PDCp-kUO6GFtQqaut6qHWt~lDxw5~MHw7d-XG-FS1L2y7SVp94U7W40~rC4OUXxiAJekkTnNrqTprCnkacd6MZ1WOUBUDEH6iOFPbHmRpt2WFjQENyNsCBACL932L4jlkaC7cHS3~8yNEGq~DDwSRJ4ku~zi5PKqRNlnNy9DmgkKZ5LZEZGmjr8wfJr5r2qy1OHKmQFbxxFj-xu9c4hB4L5qspbiK6ng6oXBY4ueEalVTArg__&Key-Pair-Id=KG9NA58BI3UFQ)
ログコピー完了ステータス
コンソールログの表示
React Nativeのデバッグにコンソールログを使用すると、console.log()のステートメントをリアルタイムで表示できます。これらのログは、VS Codeの [出力] ウィンドウの [React Native] チャネルに表示されます。
- Shift + Cmd + P(Mac)またはShift + Ctrl + P(Linux)を押して、コマンドパレットを開きます。
- 「Output: Show Output Channels...」と入力します。
- [React Native] を選択すると、アプリのコンソールログが表示されます。
アプリを実行すると、 console.logのすべてのステートメントがこのチャネルにリアルタイムで表示されます。
関連トピック
- Loggingctlを使用したシステムログの管理
- Vega Studioを使用してアプリのクラッシュをデバッグする方法
- アプリのKPIを測定
- UIレンダリングの問題の特定
- オーバードローの検出
- コンポーネントの再レンダリングに関する問題の調査
Last updated: 2025年12月22日