
Symbolicate App Crash Reports
When your React Native for Vega app or Turbo Module crashes on a Fire TV Stick or Vega Virtual Device, it generates an aggregated crash report (ACR) file. You can retrieve and symbolicate this file using Vega Studio to identify exactly where and why your app crashed.
An ACR file contains three main sections:
- Metadata - Searchable crash details including process name, crash time, and device information
- Crash information - System state data such as memory usage and device logs at the time of crash
- Dump section - Encoded crash state that requires symbolication to become readable
Symbolication converts the encoded dump section into readable code references:
Before symbolication:
0x7ff8123456ab libvega_core.so
0x7ff8987654cd libhermes.so
0x7ff8abcdef01 libvega_core.so
After symbolication:
libvega_core.so:render_frame:142
MyComponent.tsx:handlePress:87
libvega_core.so:event_dispatch:203
Each line shows: file:function:line_number
This transformation lets you identify the exact file, function, and line number where your app crashed.
Prerequisites
- An ACR file that your app generated when it crashed.
- Debug symbols or source maps (depending on code type).
Quick reference
Use this quick reference to choose the right symbolication approach for your situation:
| Your situation | Symbolication method | What it does |
|---|---|---|
You built with react-native build-kepler |
Automatic | Vega Studio finds all files automatically |
| You use custom build scripts | Manual | You specify symbol locations |
| You use a custom bundler configuration | Manual | You specify symbol locations |
| You generate bytecode bundles outside standard build | Manual | You specify symbol locations |
| You're unsure which method to use | Automatic | Try this first. Switch to Manual if it fails. |
Retrieve and symbolicate an ACR
You can retrieve and symbolicate crash reports in two ways:
- From the device sidebar: Browse device files and symbolicate directly.
- From the command palette: Copy the ACR to your machine, then symbolicate.
Both methods require a connected device. Vega displays connected devices in the sidebar. If you don't see your device, choose the Refresh devices button. If you don't have a connected device, Vega selects the Vega Virtual Device by default.
For help connecting devices, see Run Your App on Vega Virtual Device or Fire TV Stick.
From the device sidebar
-
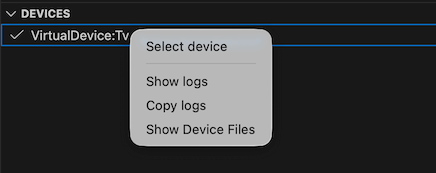
In the Vega Studio sidebar, locate your connected device.

-
Right-click on the device and select Show Device Files.
Vega Studio displays the files on your device.
-
Navigate to the crash files for your app.
-
Right-click on the crash file you want to analyze.

-
Select Symbolicate ACR.
Vega Studio automatically symbolicates the crash report and displays the results.

✓ Success: The symbolicated crash report opens with readable file paths and line numbers, showing exactly where your app crashed.
From the command palette
-
Open the command palette in VS Code:
- For Mac:
Shift+Command ⌘+P - For Linux:
Ctrl+Shift+P
- For Mac:
-
Enter Vega Device Management: Copy ACR from device.
-
Select your target device from the list if multiple devices are connected.
-
Enter the
package idorprocess id:- Package ID (recommended): Use this to retrieve all ACRs for your app. Find it in the
[package]section of your manifest.toml file (for example,com.example.myapp). - Process ID: Use this to retrieve ACRs for a specific app instance. Get it from the device's running processes (for example,
12345).
If you're unsure, use the package ID. It captures all crashes for your app regardless of which process instance crashed.
- Package ID (recommended): Use this to retrieve all ACRs for your app. Find it in the
-
If the system finds multiple ACRs, select which to download:
- Select All to download all available ACRs.
- Select latest to download only the newest ACR.
-
Save the ACR to your preferred folder.
Important: Symbolicate the ACR immediately after copying it. If you modify your code after a crash, the symbolication may not match the crash location, making it harder to debug. -
Open the command palette again and enter Vega Device Management: Symbolicate ACR.
-
Select your ACR file.
Select a symbolication option
After you start symbolication (from either method), Vega Studio prompts you to select a symbolication option:
- Automatic: Vega Studio automatically locates all required files and symbols.
- Manual: You specify symbol locations manually.
Automatic symbolication
Vega Studio collects all required configuration parameters without your input. When finished, Vega Studio displays a symbolicated call stack in the terminal. For native code, Vega Studio opens a GNU Debugger (GDB) session for interactive debugging.
- Wait for Vega Studio to collect parameters.
-
If prompted for any missing parameters:
a. Read the request carefully.
b. Enter the requested information.
c. Choose Continue.
For example, during automatic native symbolication, if no device connects, Vega Studio prompts you to provide a debug rootfs.
-
View results:
- Check the symbolicated call stack in the terminal.
- For native code, Vega Studio opens a GDB debugging session.
-
View the ACR summary:
Vega Studio generates and opens an ACR summary automatically:
- For native code: After you close the GDB debugging session
- For JavaScript code: Immediately after symbolication completes
✓ Success: The terminal displays a symbolicated call stack with readable file paths and line numbers. For native crashes, you can inspect the crash state in the GDB session.
Manual symbolication
Before you begin manual symbolication, check your package.json to validate your build configuration. If you use custom logic instead of react-native build-kepler to generate JS Hermes bytecode bundles or JS sourcemaps, ensure your Metro-generated files follow these naming conventions:
- JS plain-text bundle: index.bundle
- JS source map: *.bundle.map
In manual symbolication, Vega Studio analyzes your ACR to detect code types and routes you to the correct workflow:
| Vega Studio detects | What happens |
|---|---|
| Native code only | Starts native symbolication automatically |
| JavaScript code only | Prompts you to provide source maps |
| Both native and JavaScript | Prompts you to choose which code type to symbolicate |
<figure><a class="noExtIcon" href="https://m.media-amazon.com/images/G/01/mobile-apps/dex/vega/crash-report/decode-type.png"><img style="max-width: 90%" class="docimage border" src="https://m.media-amazon.com/images/G/01/mobile-apps/dex/vega/crash-report/decode-type._TTH_.png" alt="Screenshot that shows the choice of a decode type: gdb or js." /></a></figure>
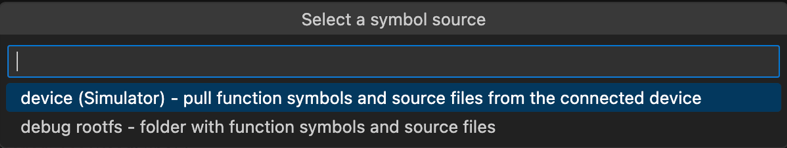
If Vega Studio detects native code only, it prompts you to:
-
Select a symbol source:

If your device connects:
- Device - Pulls symbols and libraries from the connected device
- Debug rootfs - Vega Studio prompts you to provide the debug rootfs location (a Linux filesystem version with debugging symbols for troubleshooting apps)
If your device doesn't connect:
You must provide a debug rootfs location when prompted.

-
Add additional debug symbol folders (optional):
a. Select Yes to add a folder.
b. Select the folder location.
c. Repeat or choose No to finish.
-
View results:
a. Review the symbolicated call stack in the terminal. This shows the exact code locations where the crash occurred.
b. Use the GDB debugging session to:
- Inspect variables and memory at the crash point
- Navigate through the call stack
- Examine the program state when it crashed
-
View the ACR summary:
When you close the GDB debugging session, Vega Studio generates and opens an ACR summary with processed crash information.

✓ Success: The terminal shows symbolicated native code with readable function names and line numbers. You can use the GDB session for interactive debugging.
If Vega Studio detects JavaScript code only, it prompts you to provide source maps:
- At the prompt, choose Browse.
- Navigate to the project folder.
- Select
<hash>.bundle.map. -
Add additional maps (optional):
a. At the prompt, select Yes to add more maps.
b. Select the map file location.
c. Repeat or select No to finish.
-
Review the symbolicated call stack in the terminal. This shows the exact JavaScript files and line numbers where the crash occurred.
-
View the ACR summary:
Vega Studio generates and opens an ACR summary automatically with processed crash information to help you identify the root cause.
✓ Success: The terminal displays JavaScript stack traces with readable file paths (for example, MyComponent.tsx:87) instead of memory addresses.
If Vega Studio detects both native and JavaScript code, it prompts you to choose which code type to symbolicate. Follow the native or JavaScript steps based on your selection.
✓ Success: The terminal displays the symbolicated stack trace for the code type you selected.
Next steps
After you symbolicate your ACR:
- Go to Detect Where the App Crash Originates to determine if the crash is in your code or Amazon code, and take action.
- Navigate to the identified file and line number in your code to implement a fix.
- Run your app on the same device type where the crash occurred to verify the fix.
- Check device logs after deployment to confirm the crash doesn't reappear.
Troubleshooting
If you encounter issues when analyzing ACRs, see Fix Crash Analysis Issues.
Related topics
- Detect Where the App Crash Originates
- Debug Crashes with ACR Summary
- 💬 Community: Vega supported libraries and services
Last updated: Feb 17, 2026