
Investigate JavaScript Memory
JavaScript memory exceptions cause app crashes and poor user experience. Exceeding the JavaScript heap limit (200 MB for TV profiles) triggers a Hermes Garbage Collector (HermesGC) out of memory error. Common triggers include memory leaks, large data structures, and inefficient resource cleanup.
This page explains the steps to identify, analyze, and resolve memory issues.
Step 1: Identify the crash reason
- From the device, download and open the aggregated crash report (ACR).
- In the ACR file, look for
CrashReason:SIGSEGV. - To confirm a JavaScript heap memory overflow, check the app logs for
HermesGC OOM.
Example ACR:
CrashDescriptor:1b26a2ab4b104aa474b84218e69d2780
CrashLang:Native
Process:com.org.keplerApp
LibraryName:keplerscript-runtime-loader-2.so
CrashReason:SIGSEGV
Example log:
Nov 21 20:10:13.389612 firestick-010bc8cead0041f0 local0.info keplerscript-ru[7087]: 27 I KeplerScript:[Logging.cpp:40] HermesGC OOM: [] reason = Max heap size was exceeded (1 from category: vm_allocate_category), numCollections = 177, heapSize = 205520896, allocated = 201732128, va = 205520896, external = 88.
SIGSEGV with HermesGC OOM log errors indicate JavaScript heap memory issues during runtime.
Step 2: Identify memory leak scenarios
- Open Visual Studio (VS) Code.
-
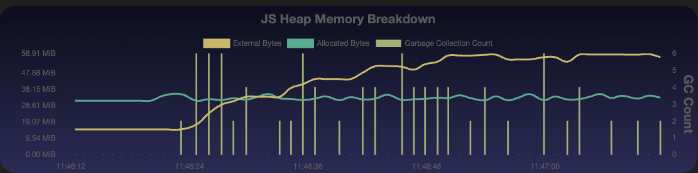
Start the Memory Monitor.
Follow the steps in Inspect your app memory consumption.
-
Track the JavaScript heap graph for 200-MB threshold approaches.

-
Record a session to capture crash scenarios.
Follow the steps in Record your app memory breakdown.
Step 3: Capture JavaScript heap snapshots
-
Attach Chrome DevTools to your React Native for Vega app. Follow the steps in Start Chrome DevTools.
-
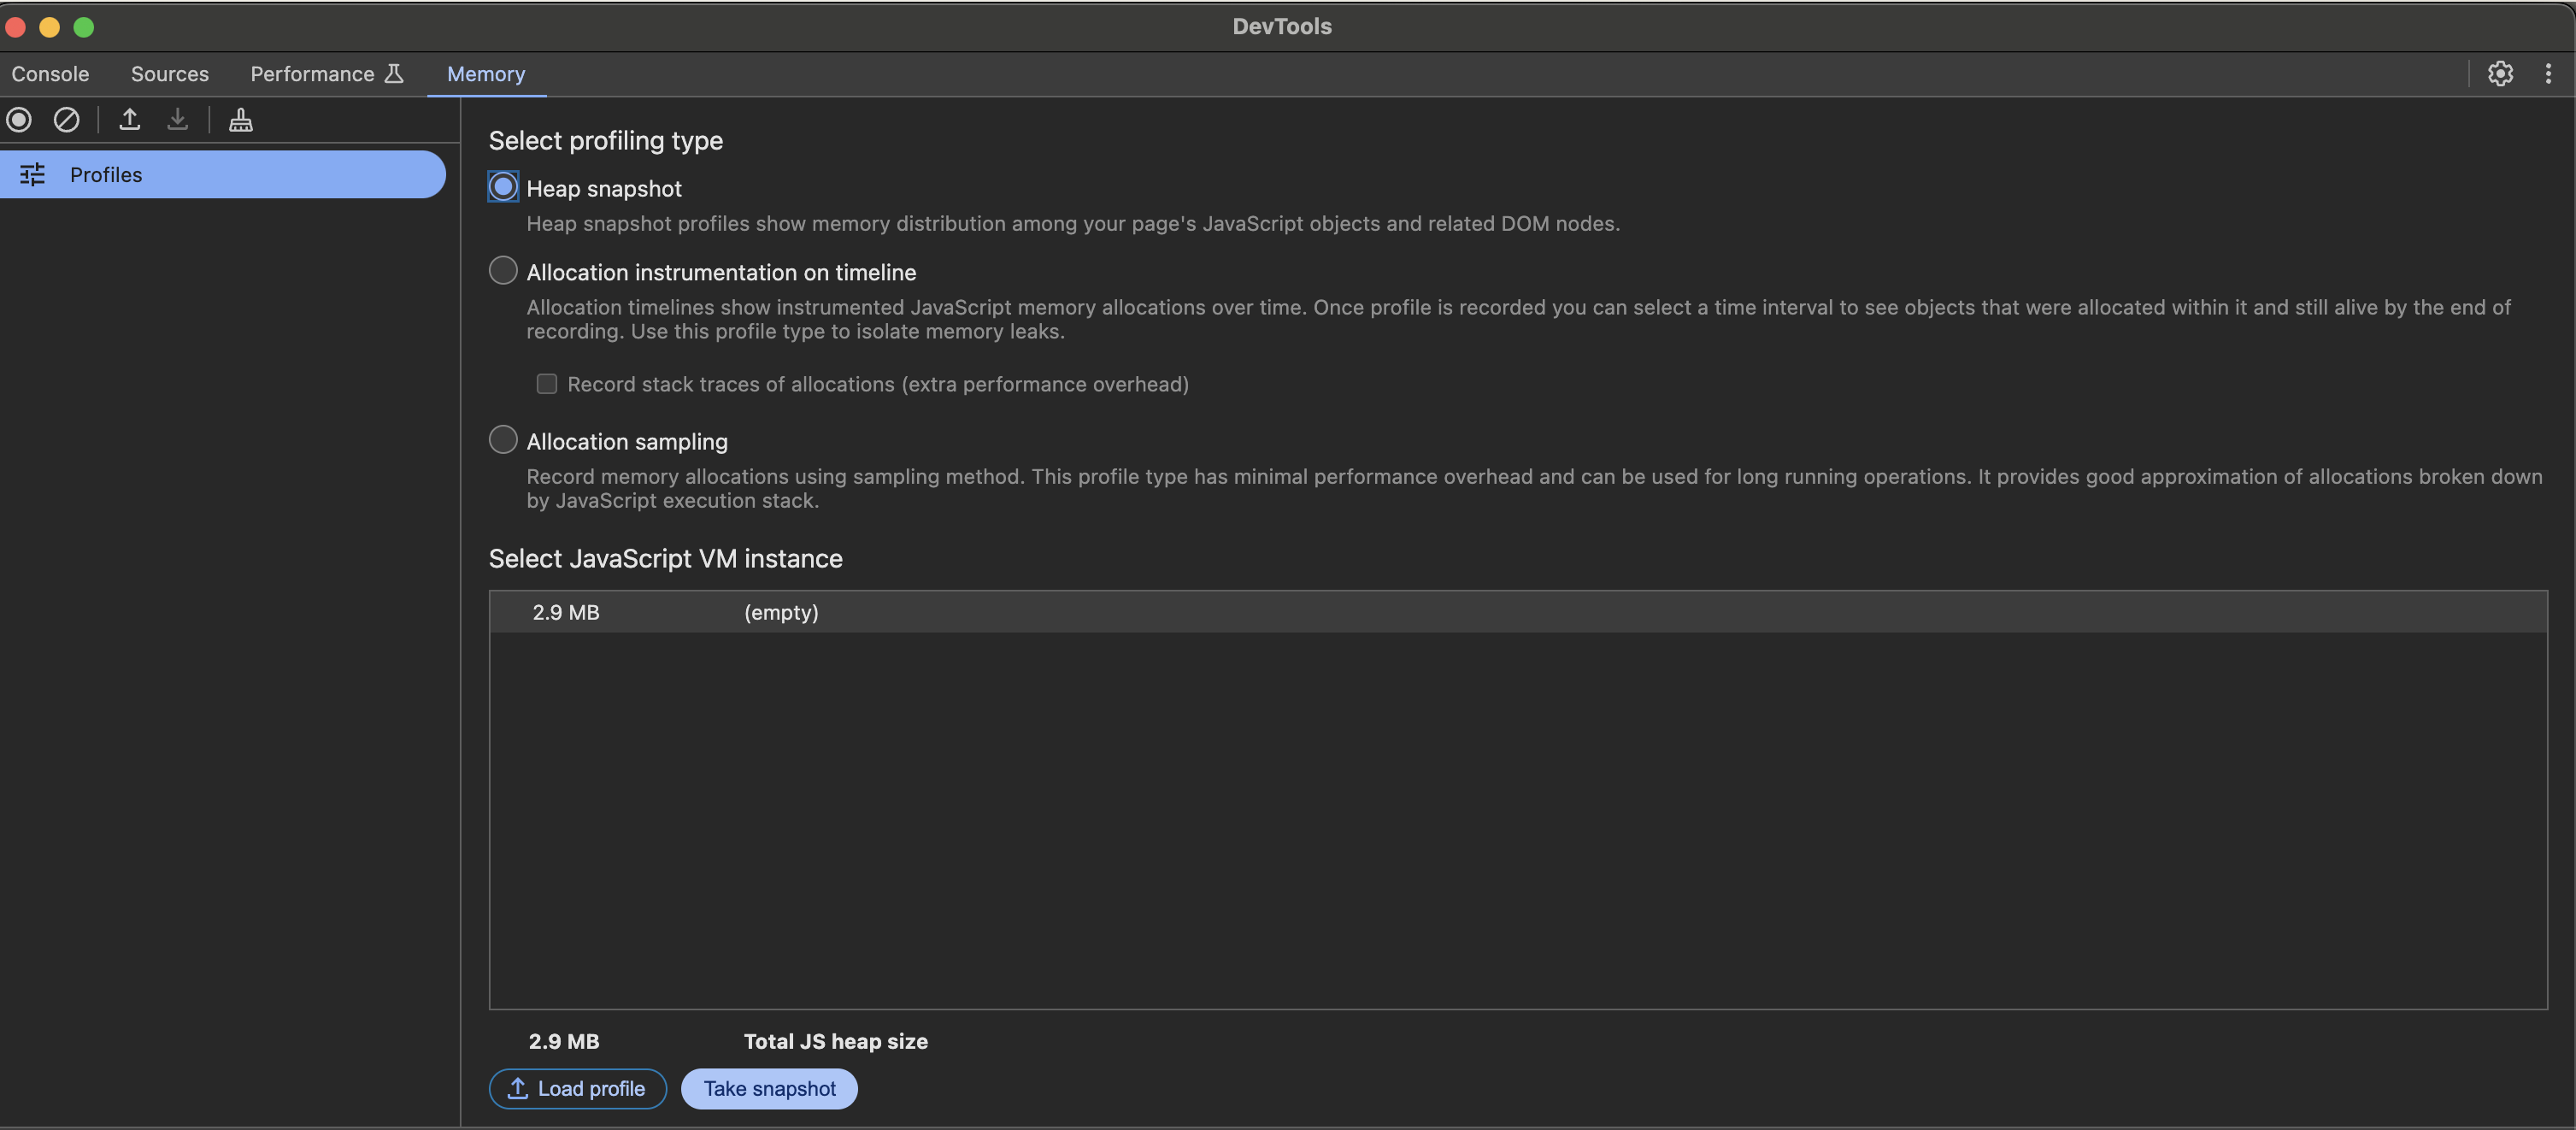
Navigate to the Memory tab and select Heap Snapshot.

-
Click Take snapshot.
The following image is an example of a heap snapshot.
-
To download the snapshot onto your host machine, click the down arrow.


Step 4: Analyze JavaScript heap snapshot
Analyze JavaScript heap snapshots using Memlab or Chrome DevTools.
Analyze with Memlab
-
Install Memlab:
npm install -g memlab -
Run the analysis:
memlab find-leaks --baseline <initial-snapshot> --target <post-leak-snapshot> --final <post-clear-snapshot> --trace-all-objectsMemlab compares three heap snapshots:
- Baseline - The initial state
- Target - The state after the potential leak
- Final - The state after cleanup
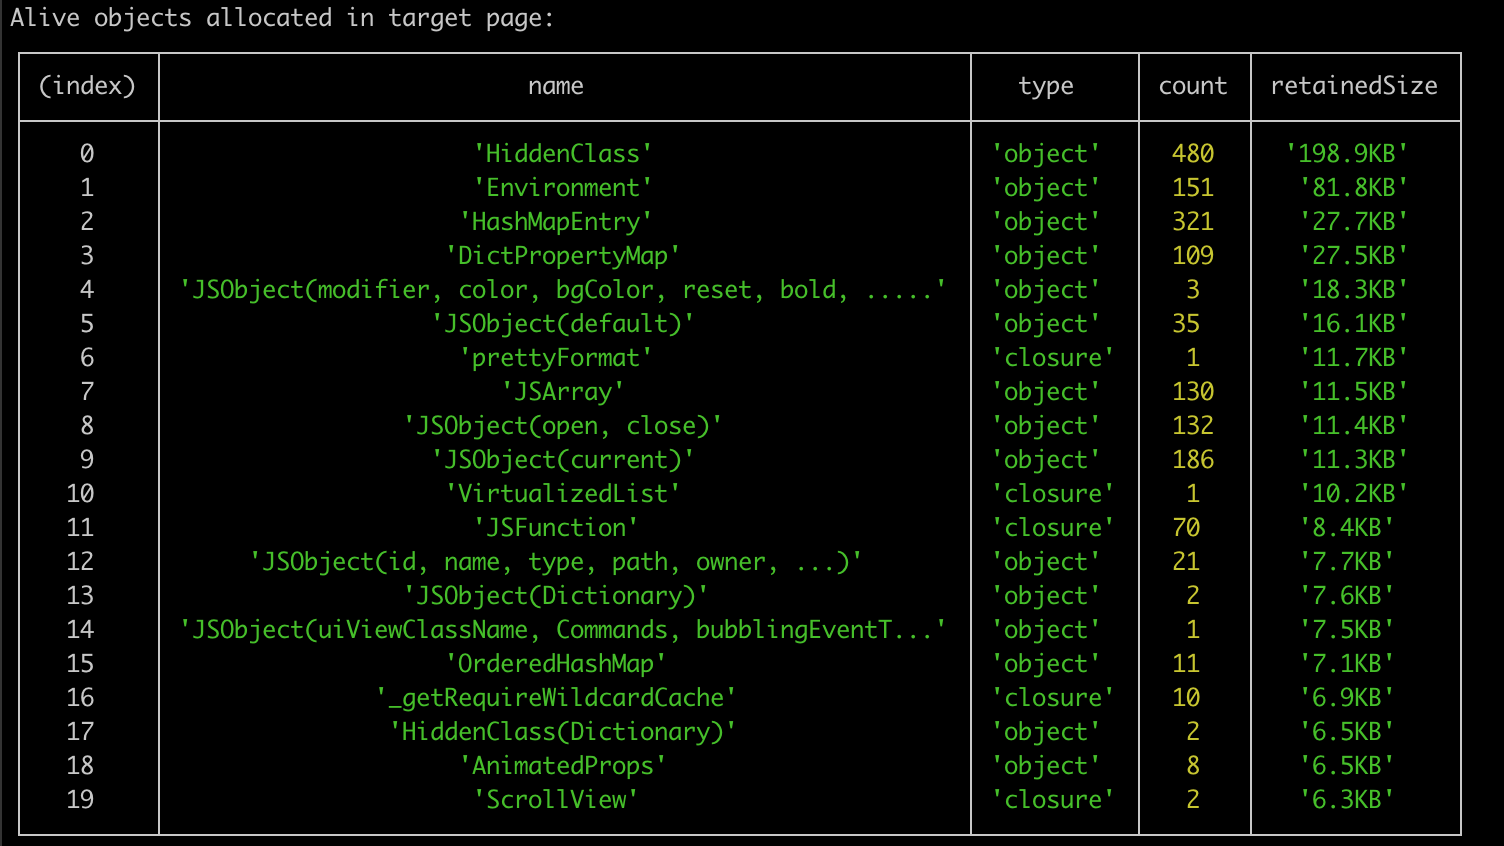
--trace-all-objectsargument marks all target page objects as potential leaks.memlab find-leakscompares the three heap snapshots and provides a summary in a table format:
-
Find uncleared objects from the table.
-
Check code for deallocating persistent objects.
-
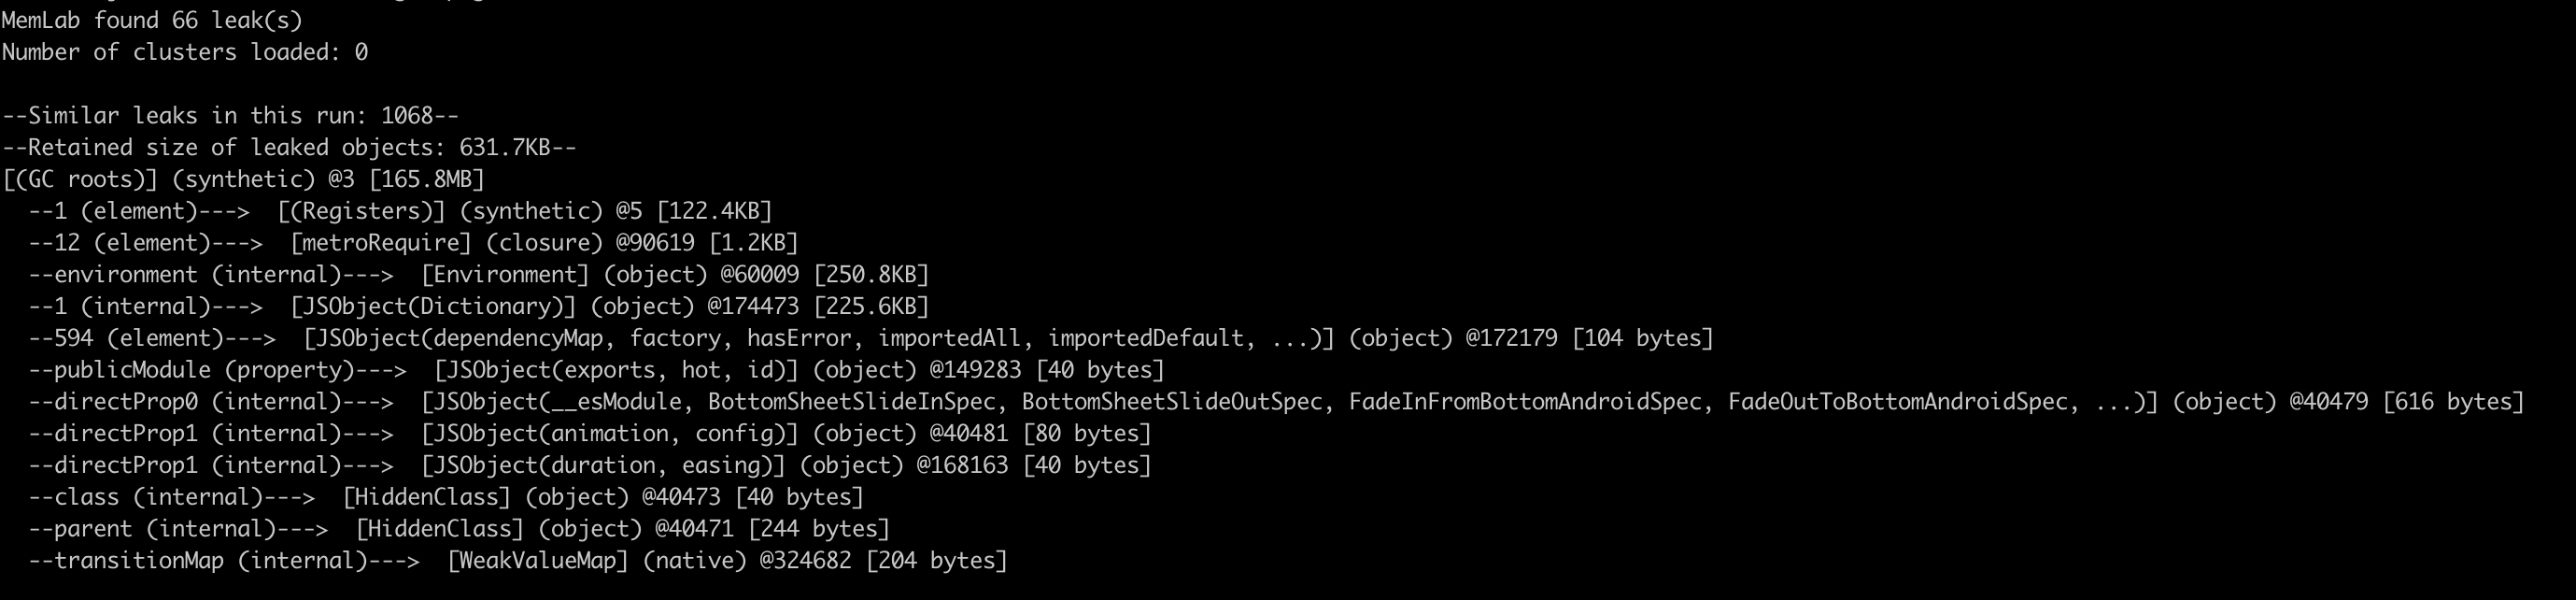
Review retainer traces.
Memlab ranks leaked objects on retained sizes. Use retainer traces to locate leaked objects in the object tree.

Learn more about Memblab:
Analyze with Chrome DevTools
-
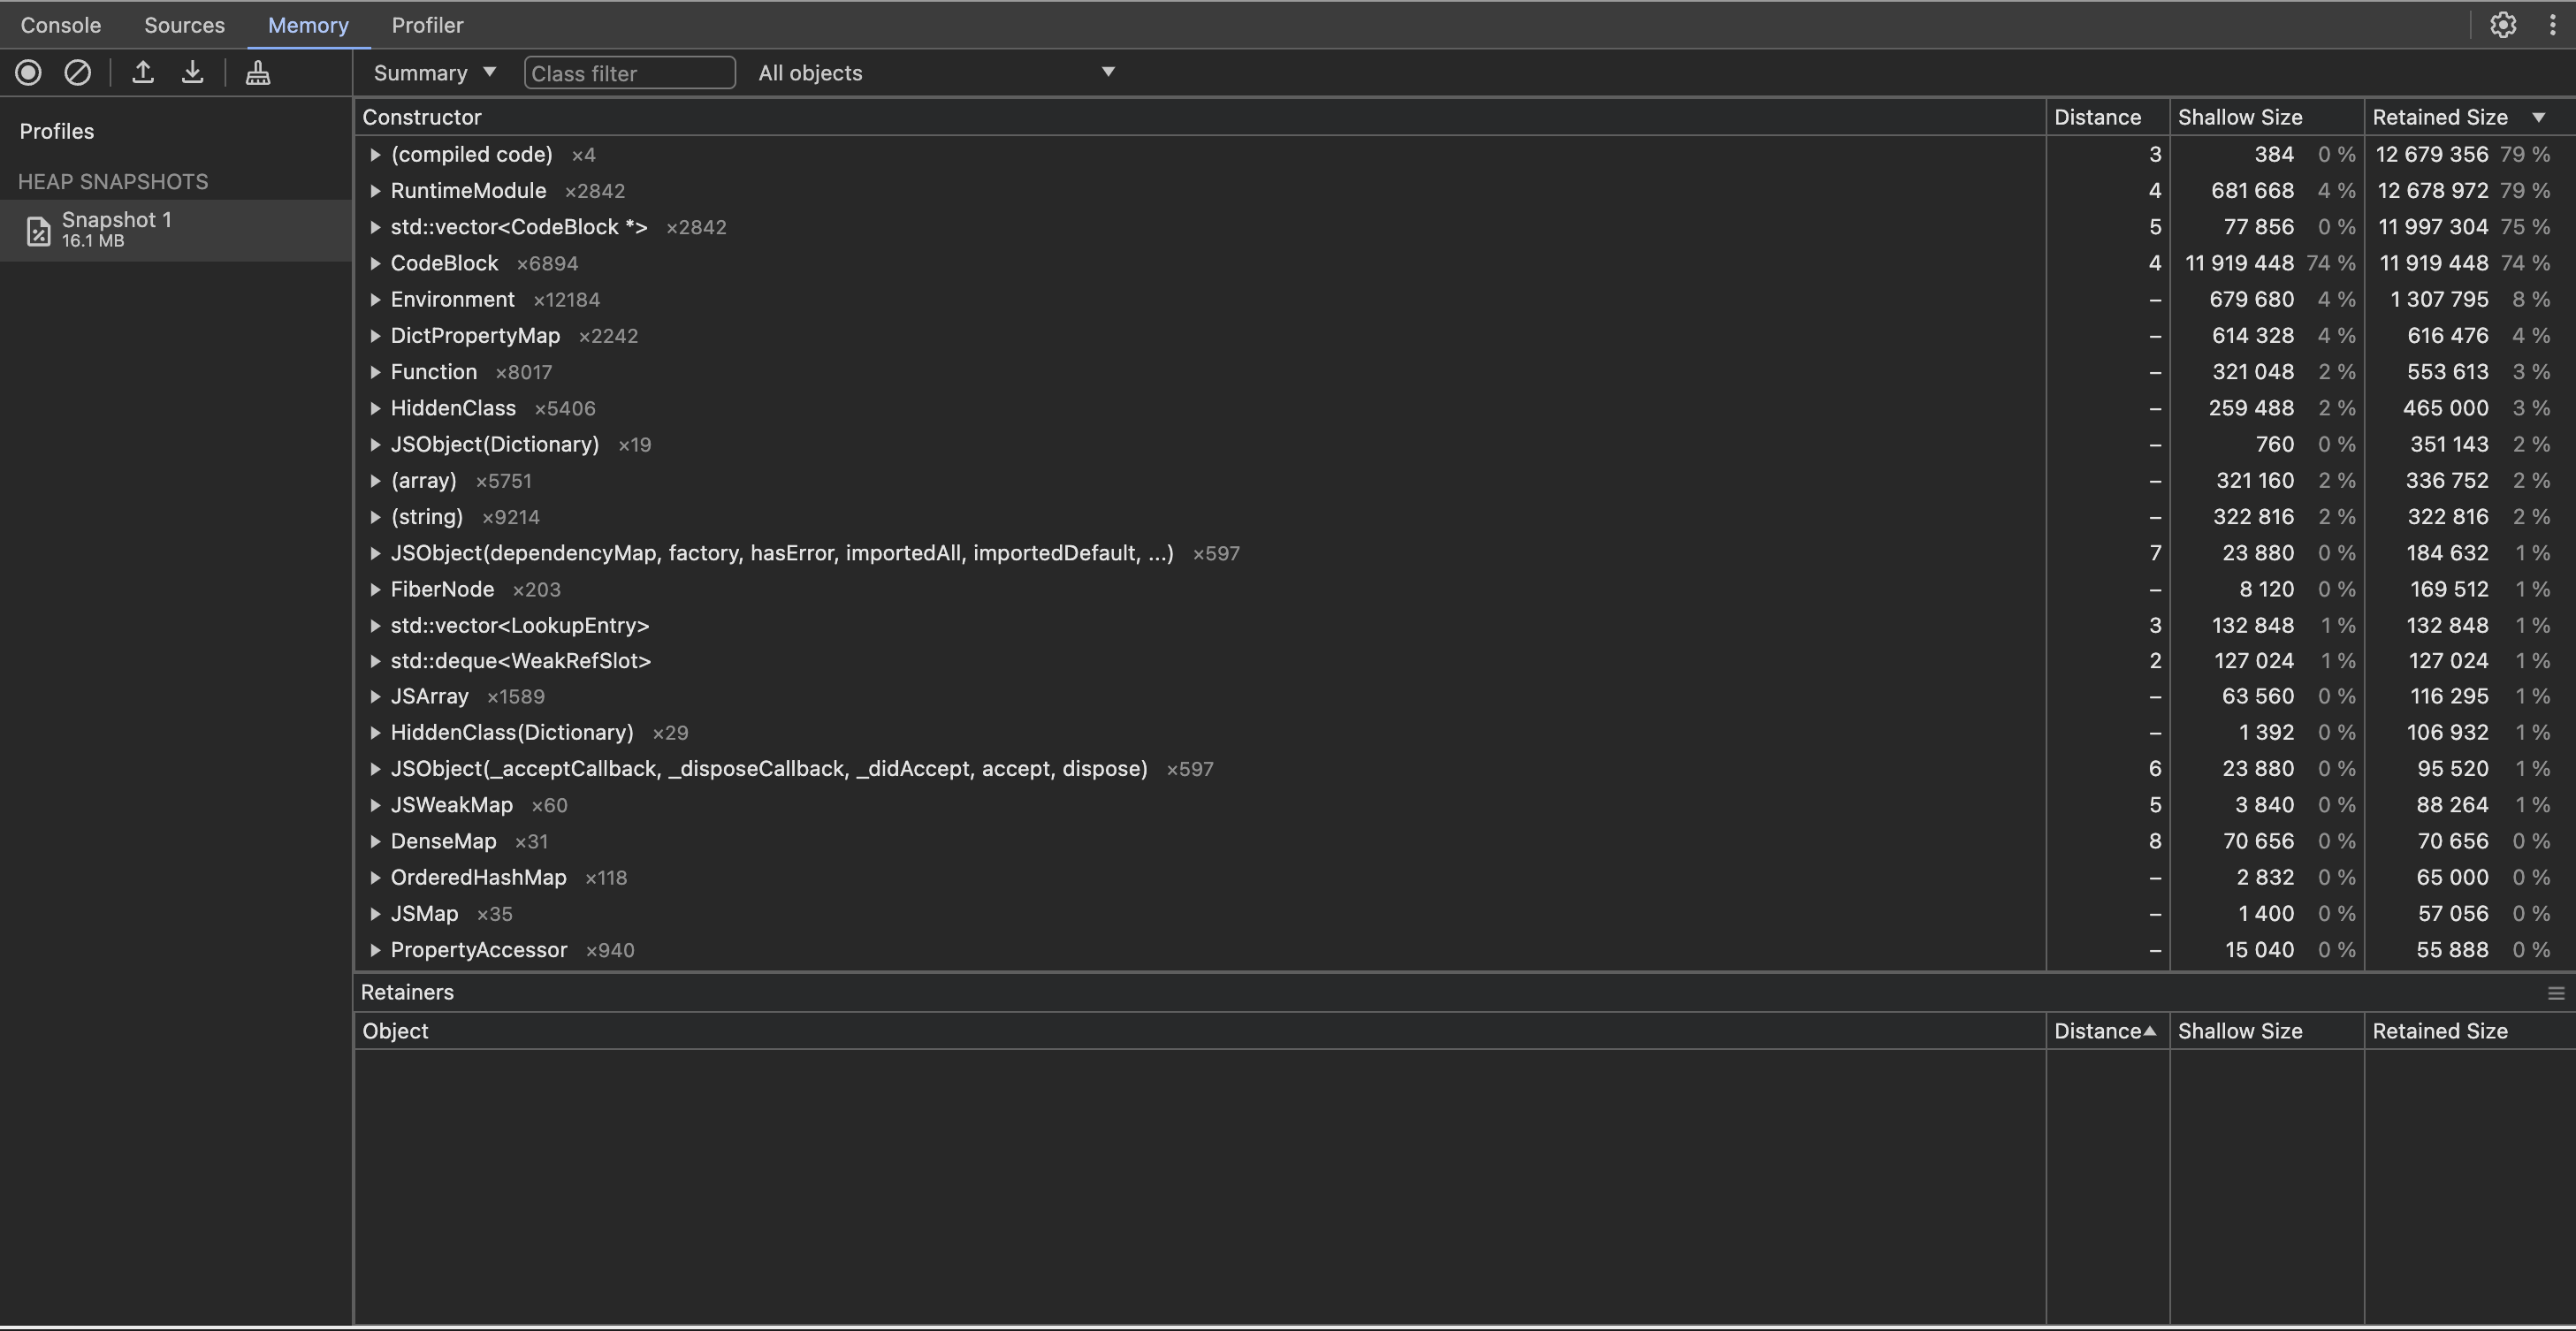
Open Chrome DevTools and go to the Memory tab.
-
Upload your JavaScript heap snapshot.
-
Analyze the JavaScript heap snapshot using different views:
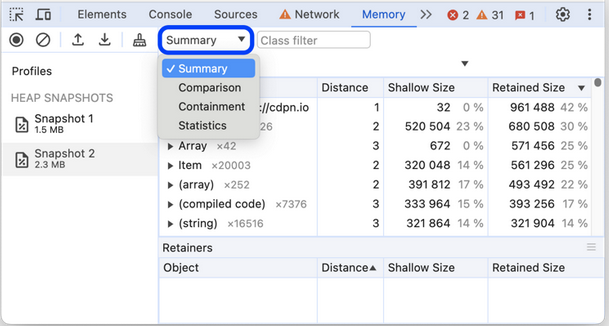

- Sort by Shallow Size to find the heaviest objects
- Sort by Retained Size to identify the most impactful objects
Select different views (Summary, Comparison, Containment, Statistics) for various analysis perspectives.
Learn about snapshots analysis:
Related topics
- Monitor CPU Usage
- Measure Performance with Chrome DevTools
- 💬 Community: How to check if my app is running out of memory?
- 💬 Community: Log script for bug reports
Last updated: Sep 30, 2025