
Vegaアプリでのトレースの検査
トレースによりコードの実行時間を測定し、パフォーマンスのボトルネックを特定できます。アプリの応答が遅い場合や遅延が発生する場合にトレースを取得すると、特に頻繁に呼び出される関数や負荷の高い操作の実行中に、コードのどの部分に時間がかかっているかを明らかにすることができます。
Vegaには、アプリのパフォーマンスを分析するためのトレースシステムであるPerfetto(英語のみ)のサポートが組み込まれています。コードの特定の領域を追跡するには、Systrace(英語のみ)を使用してトレースポイントを追加できます。これは、JavaScriptからトレースを出力できるようにするReact Native APIです。
このページでは、以下の手順について説明します。
ビデオによる概要説明
Perfettoの使い方の概要については、こちらのビデオを参照してください。
アプリへのトレースの追加
Systraceを使用して、コードの次の領域にトレースポイントを追加することを検討してください。
- 頻繁に実行される関数
- 実行に時間がかかる操作
- ユーザー操作に対応するイベントハンドラー
- パフォーマンスの問題が疑われる領域
フォーカスのパフォーマンスのトレース
TouchableOpacityコンポーネントを含むFlatListのスクロール中にフォーカスが遅くなる動作を調査するときは、onFocusコールバック関数の前後にトレースを追加します。
例:
// VegaVideoAppでのSystraceコードの例
	 import { Systrace } from "react-native";
	 const FocusableElement = ({
	   focusableElementRef,
	   children,
	   onPress,
	   onBlur,
	   onFocus,
	   getFocusState,
	   onFocusOverrideStyle,
	   style,
	   hasTVPreferredFocus,
	   ...otherProps
	 }: FocusableElementProps) => {
	   const [isFocused, setIsFocused] = useState(false);
	   const focusHandler = () => {
	     Systrace.beginEvent("VegaVideoApp:FocusedElement:onFocus"); // ---> トレース開始
	     setIsFocused(true);
	     getFocusState?.(true);
	     onFocus?.();
	     Systrace.endEvent(); // ---> トレース終了
	   };
	   const blurHandler = () => {
	     setIsFocused(false);
	     getFocusState?.(false);
	     onBlur?.();
	   };

	   return (
	     <TouchableOpacity
	       ref={focusableElementRef}
	       activeOpacity={1}
	       hasTVPreferredFocus={hasTVPreferredFocus}
	       onFocus={focusHandler}
	       onBlur={blurHandler}
	       onPress={onPress}
	       style={[style, isFocused ? onFocusOverrideStyle : undefined]}
	       testID={otherProps.testID}
	       {...otherProps}
	     >
	       {children}
	     </TouchableOpacity>
	   );
	 };
Systrace.beginEvent()呼び出しに、対応するSystrace.endEvent()があることを確認してください。Perfetto UIでトレースが未完了であると表示される場合は、前のreturnステートメントまたは例外によってSystrace.endEvent()の実行が妨げられていないかチェックしてください。アプリのトレースの記録
アプリのJavaScriptコードにトレースを追加したら、アプリを再ビルドしてVegaデバイスで実行します。その後、トレースを記録します。
手順1: アプリを再ビルドする
アプリを再ビルドして、パフォーマンストレースをアプリバンドルに取り込みます。トレースを正確に測定するために、Releaseビルド構成を使用してください。ビルド手順については、アプリのビルドを参照してください。
手順2: アプリをインストールして実行する
Vega対応デバイスに、再ビルドしたバージョンのアプリをインストールして実行します。手順については、Fire TV Stickでのアプリの実行を参照してください。
手順3: アプリのトレースを記録する
次の手順を使用して、パフォーマンスの問題のトレースを記録します。
-
オプション1: Vega StudioのActivity Monitor
-
オプション2: コマンドラインインターフェイス
a.
vega exec perf record --app-name <<対話型コンポーネントのID>>コマンドを実行して、トレースを記録します。b. recordコマンドが機能しない場合は、
vega exec perf activity-monitor --app-name <<対話型コンポーネントのID>>を実行します。たとえば、スクロールの問題に関するトレースを記録するには、次の手順に従います。
- アプリを起動します。
- Activity Monitorを実行します。
- 記録を開始します。
- アプリ内でスクロールを実行します。
- 記録を停止します。

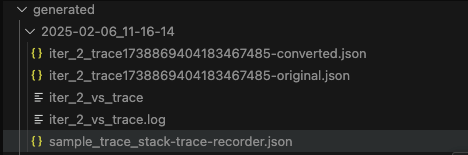
記録が完了すると、Activity Monitorによってプロジェクトの
generatedディレクトリに出力ファイルが作成されます。ディレクトリの名前は記録のタイムスタンプを示します。Activity Monitorは、プロジェクトディレクトリに以下のトレースファイルを生成します。
ファイル名 説明 iter*_trace*_-converted.json Vega Studioと互換性のあるTrace Event Format(英語のみ)のJS CPUプロファイラートレースファイル。 iter*_trace*_-original.json Chrome DevToolsと互換性のあるTrace Event Format(英語のみ)のJS CPUプロファイラートレースファイル。 iter*_vs_trace Perfettoトレースファイル。 *trace-recorder.json Activity Monitorによって記録されたトレースファイル。
このファイルをRecording Viewで開くと、Activity Monitorで収集されたデータを検査することができます。
Perfetto UIでのアプリのトレースの分析
トレースを収集したら、Perfetto UI(英語のみ)を使用してカスタムトレースの継続時間と呼び出しパターンを分析します。
-
Perfetto UIでトレースファイルを開きます。
![Perfettoの [Open trace file] を示すスクリーンショット。](https://m.media-amazon.com/images/G/01/mobile-apps/dex/vega/inspect-traces/perfetto._TTH_.png)
- [Open trace file] を選択します。
- generatedディレクトリからiter*_vs_traceファイルを選択するか、Perfetto UIウェブページにドラッグします。
- トレースが読み込まれるまで待ちます。
-
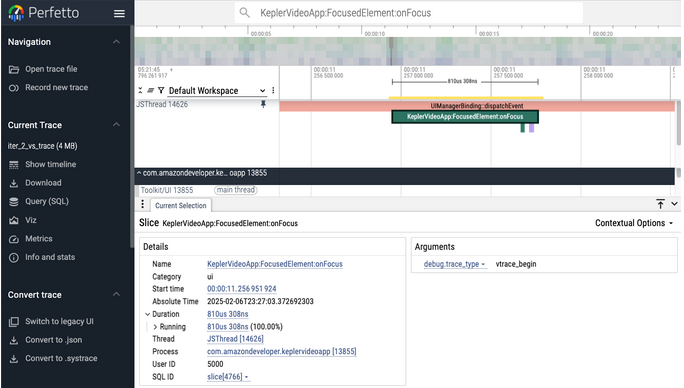
上部の検索バーにトレース名を入力して、追加したトレースを検索します。次の画像は、
onFocusハンドラーに追加されたVegaVideoApp:FocusedElement:onFocusトレースを示しています。
Vega Studio拡張機能がインストールされている場合は、VS Codeでトレースファイルを直接開くことができます。
- VS Codeのプロジェクトで生成されたディレクトリに移動します。
- 表示するトレースファイルを選択します。ファイルはVS Code内のPerfetto UIで開きます。
各トレースについて、次の操作を行います。
- すべての記録箇所で継続時間を分析して、想定された動作を検証します。
- すべてのスタックトレースを調べて、想定された呼び出しパターンを確認します。
![Perfettoの [Open trace file] を示すスクリーンショット。](https://m.media-amazon.com/images/G/01/mobile-apps/dex/vega/inspect-traces/perfetto.png)
Perfettoによるパフォーマンスパターンの分析
Perfettoは、個々のトレースを検査するだけでなく、滑らかさや応答性に影響を及ぼすさまざまなパフォーマンスパターンを特定するために役立ちます。以下のサブセクションでは、一般的な分析手法について詳しく説明します。
イベントの処理時間の分析
UIManagerBinding::dispatchEventスライスは、各UIイベントのJSスレッドでの処理にかかった時間を示します。各スライスには、イベントタイプを識別するdebug.type引数があります。フォーカスの設定と解除を分析するには、debug.typeがtopFocusまたはtopBlurのスライスを探します。
イベントの継続時間が長い場合、イベントハンドラーにブロッキング処理があることを示しています。
イベントの処理時間を分析するには、次の手順に従います。
- Perfetto UIの検索バーで、
UIManagerBinding::dispatchEventを検索します。 - スライスを選択して詳細を表示します。
- 詳細パネルで
debug.type引数を確認して、イベントタイプ(topFocus、topBlur、topLoadなど)を特定します。 - フォーカスの設定イベントと解除イベントのスライスの継続時間を確認します。これらのイベントは16ミリ秒未満で完了することが求められます。
- イベントの継続時間に特定のパターンがないかどうかを調べます。たとえば、
topFocusイベントに常に50ミリ秒かかっている場合は、onFocusハンドラー内にブロッキング処理があることを示しています。
イベントハンドラーを最適化する方法については、アプリのパフォーマンスに関するベストプラクティスを参照してください。JSスレッドのアクティビティをさらに詳しく調べるには、JavaScriptスレッドのパフォーマンスの調査を参照してください。
次の表は、イベントハンドラーにブロッキング処理を含むサンプルアプリから取得された指標の例を示しています。実際のアプリの値は、アプリの実装によって異なります。
| 指標 | 値 |
|---|---|
| イベントの最大継続時間 | 52.66ミリ秒 |
| イベントの平均継続時間 | 17.39ミリ秒 |
| フォーカス設定イベント(~50ミリ秒) | 21イベント |
| フォーカス解除イベント(~22ミリ秒) | 4イベント |
この例では、50~52ミリ秒を要したフォーカス設定イベントは、フォーカス設定ハンドラー内の同期ブロッキング処理に直接対応付けられます。約22ミリ秒を要したフォーカス解除イベントは、フォーカス解除ハンドラーに同様のブロッキング処理があることを示しています。
独自のトレースからこれらの指標を生成するには、Perfettoのクエリエディター([Query (SQL)] タブ)で、次のSQLクエリを実行します。
SELECT
  EXTRACT_ARG(s.arg_set_id, 'debug.type') AS event_type,
  COUNT(*) AS count,
  AVG(s.dur) / 1e6 AS avg_duration_ms,
  MIN(s.dur) / 1e6 AS min_duration_ms,
  MAX(s.dur) / 1e6 AS max_duration_ms
FROM slice s
WHERE s.name = 'UIManagerBinding::dispatchEvent'
GROUP BY event_type
ORDER BY avg_duration_ms DESC;
このクエリは、すべてのUIManagerBinding::dispatchEventスライスをdebug.typeごと(topFocus、topBlur、topLoadなど)にグループ化し、各タイプの数と、継続時間の平均値、最小値、最大値を計算します。
UIManagerBinding::dispatchEventスライスを選択すると、その正確な継続時間と、入れ子にされている関数呼び出しが表示されます。これは、遅延の原因となっているコードを特定するために役立ちます。Perfettoでのトレースの操作方法を視覚的に確認するには、フレームタイミングの分析のアニメーションを参照してください。
フレームタイミングの分析
滑らかさに問題がある場合は、frameスライスを調査して、ナビゲーション中やスクロール中にドロップフレームが発生していないかどうかを特定します。
次のアニメーションは、Perfetto UIで継続時間の長いフレームを特定する方法を示しています。

フレームタイミングを分析するには、次の手順に従います。
- Perfetto UIで、アプリのプロセスの
frameトラックを見つけます。 - 16.67ミリ秒(60fpsでのレンダリングに許容される時間)を超えるフレームを特定します。継続時間の長いフレームは、タイムラインに幅の広いバーとして表示されます。
- 想定よりも長いフレームのある領域を拡大します。
次の表は、同じサンプルアプリから取得されたフレームタイミング指標の例を示しています。これらを独自のトレースデータと比較して、独自のアプリの滑らかさを評価してください。
| 指標 | 値 |
|---|---|
| フレームの合計数 | 468 |
| 16ミリ秒を超えるフレーム | 6 |
| 33ミリ秒を超えるフレーム | 1 |
| 50ミリ秒を超えるフレーム | 1 |
| フレームの最大継続時間 | 62.94ミリ秒 |
| フレームの平均継続時間 | 3.11ミリ秒 |
1つのフレームに62.94ミリ秒かかったということは、アプリで約4フレームがドロップされたことを意味します(62.94ミリ秒÷16.67ミリ秒≒4)。このデータは、KPI Visualizerの「5+ Consecutive Dropped Frames」KPIに関連付けられます。滑らかさの指標の詳細については、アプリKPIの測定を参照してください。UIレンダリングの問題を調査するには、UIレンダリングの問題の特定を参照してください。
独自のトレースからフレームタイミングの概要を生成するには、Perfettoのクエリエディター([Query (SQL)] タブ)で、次のSQLクエリを実行します。
WITH stats AS (
  SELECT
    COUNT(*) AS total_events,
    SUM(CASE WHEN s.dur / 1e6 > 16 THEN 1 ELSE 0 END) AS over_16ms,
    SUM(CASE WHEN s.dur / 1e6 > 33 THEN 1 ELSE 0 END) AS over_33ms,
    SUM(CASE WHEN s.dur / 1e6 > 50 THEN 1 ELSE 0 END) AS over_50ms,
    MAX(s.dur) / 1e6 AS max_dur_ms,
    AVG(s.dur) / 1e6 AS avg_dur_ms
  FROM slice s
  WHERE s.name = 'UIManagerBinding::dispatchEvent'
)
SELECT 'Total events' AS Metric, CAST(total_events AS TEXT) AS Value FROM stats
UNION ALL
SELECT 'Events over 16ms', CAST(over_16ms AS TEXT) FROM stats
UNION ALL
SELECT 'Events over 33ms', CAST(over_33ms AS TEXT) FROM stats
UNION ALL
SELECT 'Events over 50ms', CAST(over_50ms AS TEXT) FROM stats
UNION ALL
SELECT 'Max duration', PRINTF('%.2fms', max_dur_ms) FROM stats
UNION ALL
SELECT 'Avg duration', PRINTF('%.2fms', avg_dur_ms) FROM stats;
このクエリは、一般的なフレームバジェットのしきい値(60fpsで16ミリ秒、ドロップフレーム2回で33ミリ秒、ドロップフレーム3回以上で50ミリ秒)を超えるイベントの数をカウントし、継続時間の最大値と平均値をレポートします。
JSの処理とフレームドロップの相関関係
Perfettoの分析から得られる重要な洞察に、JSスレッドのブロックとフレームドロップの相関関係があります。JSスレッドが同期処理によってビジー状態になると、滑らかさと応答性の両方が損なわれます。特定手順を視覚的に確認するには、フレームタイミングの分析のアニメーションを参照してください。
この状況が発生する一般的な流れは次のようになります。
- ユーザーがD-padボタン(右方向など)を押します。
- 新しくフォーカスが設定された要素で、
onFocusハンドラーが呼び出されます。- ブロッキング処理(同期的なデータチェックなど)がJSスレッドを占有します。
- 非ネイティブのアニメーションがあると、JSスレッドの処理がさらに増加します。
- この処理の間、複数のフレームがレンダリングできなくなります。
- ユーザー側では、フォーカスの動きにつっかかりや遅延が認められます。
このパターンをPerfettoで特定するには、次の手順に従います。
frameトラックで、ドロップフレームのある領域を見つけます。- 同じ時間枠の中で、フレームトラック付近のJSスレッドのアクティビティを確認します。
- 長い
UIManagerBinding::dispatchEventスライスがドロップフレームに重なっていないかどうかを確認します。
JSスレッドのブロックとフレームドロップが連動している場合、根本的な原因は、イベントハンドラー内の同期処理または非ネイティブアニメーションにあることが一般的です。これらの問題に対処するための最適化手法については、アプリのパフォーマンスに関するベストプラクティスを参照してください。
関連トピック
Last updated: 2026年3月20日